
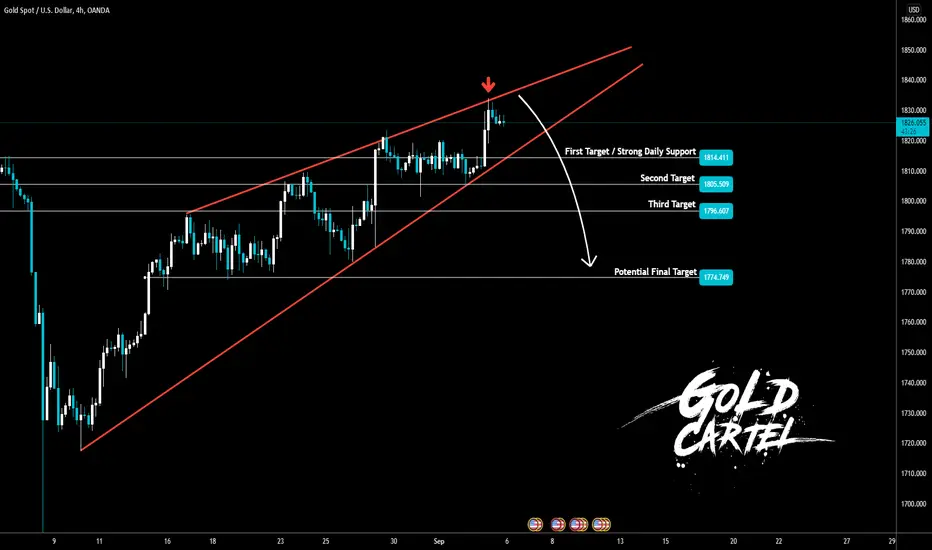
Currently, the price action showing a potential rising wedge on the H4 time-frame.
Plan:
- If the price rejects and stays below the upper rising wedge line, I reckon XAU will fall to the bottom rising wedge line. If the price can break and close below the bottom rising wedge line, XAU will definitely fall to all the targets this month.
Invalidation:
- This analysis fails if the price breakout and close above the upper rising wedge line
A rising wedge is a technical indicator, suggesting a reversal pattern frequently seen in bear markets. This pattern shows up in charts when the price moves upward, with pivot highs and lows converging toward a single point known as the apex. -*Investopedia
Plan:
- If the price rejects and stays below the upper rising wedge line, I reckon XAU will fall to the bottom rising wedge line. If the price can break and close below the bottom rising wedge line, XAU will definitely fall to all the targets this month.
Invalidation:
- This analysis fails if the price breakout and close above the upper rising wedge line
A rising wedge is a technical indicator, suggesting a reversal pattern frequently seen in bear markets. This pattern shows up in charts when the price moves upward, with pivot highs and lows converging toward a single point known as the apex. -*Investopedia

免責聲明
這些資訊和出版物並非旨在提供,也不構成TradingView提供或認可的任何形式的財務、投資、交易或其他類型的建議或推薦。請閱讀使用條款以了解更多資訊。
免責聲明
這些資訊和出版物並非旨在提供,也不構成TradingView提供或認可的任何形式的財務、投資、交易或其他類型的建議或推薦。請閱讀使用條款以了解更多資訊。