
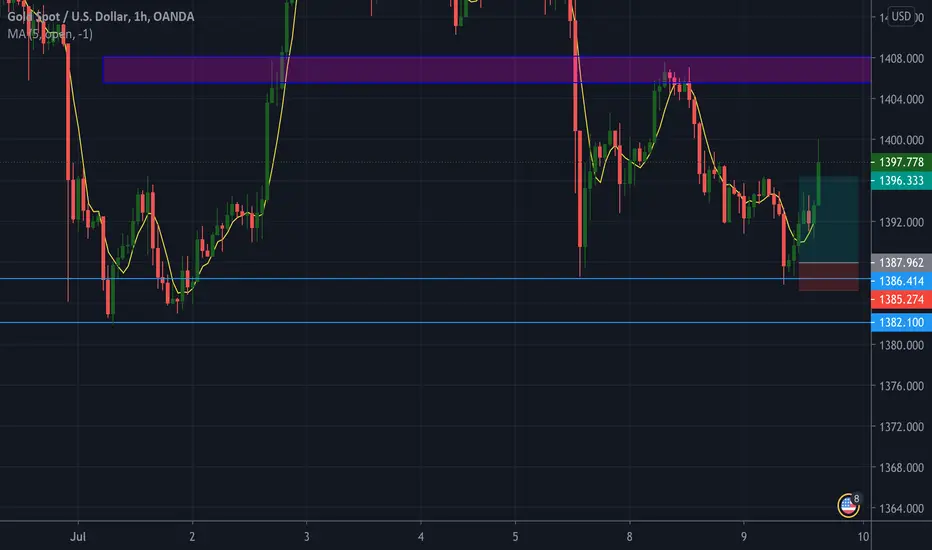
Took a buy on the bullish retest as price is in major downtrend.
Now looking at the Gold/USD hourly & 15 min charts on July 9th 2019. Gold has been in a bearish trend since July 3rd, after reaching 6 year high at 1438.900 zone. Going to a higher timeframe, in the daily, we see that price could Not top this high after attempting to breakthrough twice. Once on June 25th & again on July 3rd ( 5 candles in between).
Price has been creating lower highs & lower lows since the 3rd of July, indicating down trend. 3 bearish candles appear after not being able to break high. With price currently at 1397.778 I am now looking for sells down to the 1382.100 zone after retest.
Using the Fibonacci retracement tool, I will set my tp & sl respecting its support & resistance levels.
Now looking at the Gold/USD hourly & 15 min charts on July 9th 2019. Gold has been in a bearish trend since July 3rd, after reaching 6 year high at 1438.900 zone. Going to a higher timeframe, in the daily, we see that price could Not top this high after attempting to breakthrough twice. Once on June 25th & again on July 3rd ( 5 candles in between).
Price has been creating lower highs & lower lows since the 3rd of July, indicating down trend. 3 bearish candles appear after not being able to break high. With price currently at 1397.778 I am now looking for sells down to the 1382.100 zone after retest.
Using the Fibonacci retracement tool, I will set my tp & sl respecting its support & resistance levels.

免責聲明
這些資訊和出版物並非旨在提供,也不構成TradingView提供或認可的任何形式的財務、投資、交易或其他類型的建議或推薦。請閱讀使用條款以了解更多資訊。
免責聲明
這些資訊和出版物並非旨在提供,也不構成TradingView提供或認可的任何形式的財務、投資、交易或其他類型的建議或推薦。請閱讀使用條款以了解更多資訊。