
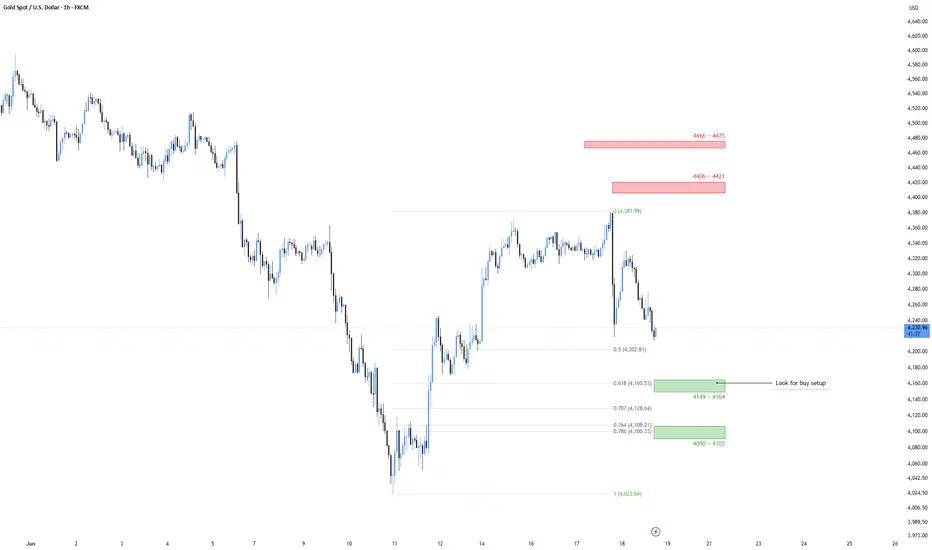
XAUUSD – Incomplete Bottom Formation? One More Rally Before the Final Corrective Leg
Gold has recovered aggressively from the 4023 low, but the broader structure still suggests the market may be building a larger corrective sequence rather than a completed long-term bottom.
While many participants are beginning to interpret the recent recovery as the start of a new bullish cycle, the current structure appears incomplete from both a liquidity and wave-development perspective.
The key question is not whether gold can rally further.
The key question is whether the rally from 4023 has done enough work to complete the entire correction.
At the moment, evidence suggests it has not.
Macro Landscape
The medium-term fundamental picture remains mixed.
On one side, central-bank accumulation, fiscal concerns, and persistent geopolitical uncertainty continue to provide structural support for gold.
On the other side, the Federal Reserve remains cautious regarding aggressive easing, real yields remain elevated relative to historical standards, and the US Dollar has not yet entered a sustained structural downtrend.
This creates an environment where sharp rallies can occur, but trend continuation higher becomes increasingly difficult unless liquidity conditions improve significantly.
As a result, the recent advance can still be interpreted as a corrective repricing rather than the start of a new secular bullish expansion.
Market Structure Analysis
From a pure price-action perspective, the recovery from 4023 resembles a corrective sequence following a large impulsive decline.
Several observations support this view:
The market has already demonstrated the ability to reclaim key retracement levels, but reclaiming levels alone does not confirm a major bottom.
A major bottom typically requires complete liquidation, broad capitulation, and a convincing impulsive reversal.
Those characteristics are not yet fully visible.
Liquidity Framework
The most obvious liquidity pools remain above current price.
Key upside targets:
These areas represent:
A move into these regions would complete a far more proportional corrective structure and allow the market to collect liquidity currently resting above recent highs.
Primary Scenario (Preferred)
The preferred scenario remains a continuation of the corrective rally toward the 4440–4470 region.
Requirements:
Under this scenario, the market extends upward into premium territory, sweeps resting liquidity, and completes the final bullish leg of the correction.
This move would not automatically confirm a new bull market.
Instead, it would create the conditions necessary for a larger corrective decline.
Secondary Scenario – Final Corrective Decline
If the market reaches the 4440–4470 region and begins showing exhaustion characteristics, attention shifts toward a deeper retracement phase.
Signs to monitor:
If those conditions appear, the probability increases that the current rally was simply the final leg of a larger correction.
In that case, downside objectives become:
This region would represent a significantly more attractive area for long-term accumulation because it would offer:
Bullish Alternative
The bearish-cycle thesis becomes significantly weaker if price achieves sustained acceptance above 4475.
A successful breakout followed by support formation above that zone would suggest that the market is no longer correcting but transitioning into a new bullish expansion.
Until that occurs, upside strength should be treated as part of the corrective process rather than definitive proof of trend reversal.
Conclusion
The recovery from 4023 appears impressive, but structurally it may still be incomplete.
Current price action suggests the market could require one additional bullish expansion toward 4440–4470 to complete the corrective structure and collect remaining buy-side liquidity.
Only after that process is completed would conditions become favorable for a final corrective decline toward the 3950–3850 region, where a more convincing long-term bottom could emerge.
Preferred Path:
4023 Bottom → Corrective Rally → Liquidity Sweep at 4440–4470 → Final Corrective Decline toward 3950–3850 → Major Bottom Formation
Invalidation:
Sustained acceptance and structural support above 4475 would invalidate the corrective-top thesis and increase the probability that a new bullish trend is already underway.
Gold has recovered aggressively from the 4023 low, but the broader structure still suggests the market may be building a larger corrective sequence rather than a completed long-term bottom.
While many participants are beginning to interpret the recent recovery as the start of a new bullish cycle, the current structure appears incomplete from both a liquidity and wave-development perspective.
The key question is not whether gold can rally further.
The key question is whether the rally from 4023 has done enough work to complete the entire correction.
At the moment, evidence suggests it has not.
Macro Landscape
The medium-term fundamental picture remains mixed.
On one side, central-bank accumulation, fiscal concerns, and persistent geopolitical uncertainty continue to provide structural support for gold.
On the other side, the Federal Reserve remains cautious regarding aggressive easing, real yields remain elevated relative to historical standards, and the US Dollar has not yet entered a sustained structural downtrend.
This creates an environment where sharp rallies can occur, but trend continuation higher becomes increasingly difficult unless liquidity conditions improve significantly.
As a result, the recent advance can still be interpreted as a corrective repricing rather than the start of a new secular bullish expansion.
Market Structure Analysis
From a pure price-action perspective, the recovery from 4023 resembles a corrective sequence following a large impulsive decline.
Several observations support this view:
- The rally lacks the displacement normally seen at major cycle bottoms.
- The bullish leg has not yet fully retraced the preceding bearish expansion.
- Higher-timeframe premium liquidity remains untouched above current highs.
- The structure currently appears more consistent with an evolving corrective phase than a completed trend reversal.
The market has already demonstrated the ability to reclaim key retracement levels, but reclaiming levels alone does not confirm a major bottom.
A major bottom typically requires complete liquidation, broad capitulation, and a convincing impulsive reversal.
Those characteristics are not yet fully visible.
Liquidity Framework
The most obvious liquidity pools remain above current price.
Key upside targets:
- 4406 – 4421
- 4466 – 4475
These areas represent:
- Buy-side liquidity.
- Previous distribution zones.
- Premium pricing relative to the recent range.
- Potential locations for smart-money profit-taking and distribution.
A move into these regions would complete a far more proportional corrective structure and allow the market to collect liquidity currently resting above recent highs.
Primary Scenario (Preferred)
The preferred scenario remains a continuation of the corrective rally toward the 4440–4470 region.
Requirements:
- Price maintains acceptance above the 4200 area.
- No decisive bearish market structure shift develops before higher liquidity is collected.
- Buy-side liquidity above recent highs remains intact.
Under this scenario, the market extends upward into premium territory, sweeps resting liquidity, and completes the final bullish leg of the correction.
This move would not automatically confirm a new bull market.
Instead, it would create the conditions necessary for a larger corrective decline.
Secondary Scenario – Final Corrective Decline
If the market reaches the 4440–4470 region and begins showing exhaustion characteristics, attention shifts toward a deeper retracement phase.
Signs to monitor:
- Bearish displacement from premium liquidity.
- Failure to hold above reclaimed highs.
- Lower-timeframe MSS after liquidity collection.
- Strong rejection candles from the premium zone.
If those conditions appear, the probability increases that the current rally was simply the final leg of a larger correction.
In that case, downside objectives become:
- 3950
- 3850
This region would represent a significantly more attractive area for long-term accumulation because it would offer:
- A completed corrective cycle.
- Deeper discount pricing.
- Greater liquidation of remaining bullish positioning.
- Potential alignment with a renewed macro accumulation phase.
Bullish Alternative
The bearish-cycle thesis becomes significantly weaker if price achieves sustained acceptance above 4475.
A successful breakout followed by support formation above that zone would suggest that the market is no longer correcting but transitioning into a new bullish expansion.
Until that occurs, upside strength should be treated as part of the corrective process rather than definitive proof of trend reversal.
Conclusion
The recovery from 4023 appears impressive, but structurally it may still be incomplete.
Current price action suggests the market could require one additional bullish expansion toward 4440–4470 to complete the corrective structure and collect remaining buy-side liquidity.
Only after that process is completed would conditions become favorable for a final corrective decline toward the 3950–3850 region, where a more convincing long-term bottom could emerge.
Preferred Path:
4023 Bottom → Corrective Rally → Liquidity Sweep at 4440–4470 → Final Corrective Decline toward 3950–3850 → Major Bottom Formation
Invalidation:
Sustained acceptance and structural support above 4475 would invalidate the corrective-top thesis and increase the probability that a new bullish trend is already underway.

For live market updates and high-probability setups, join my Telegram: t.me/G_Traders
相關出版品
免責聲明
這些資訊和出版物並非旨在提供,也不構成TradingView提供或認可的任何形式的財務、投資、交易或其他類型的建議或推薦。請閱讀使用條款以了解更多資訊。
For live market updates and high-probability setups, join my Telegram: t.me/G_Traders
相關出版品
免責聲明
這些資訊和出版物並非旨在提供,也不構成TradingView提供或認可的任何形式的財務、投資、交易或其他類型的建議或推薦。請閱讀使用條款以了解更多資訊。