
Market Structure
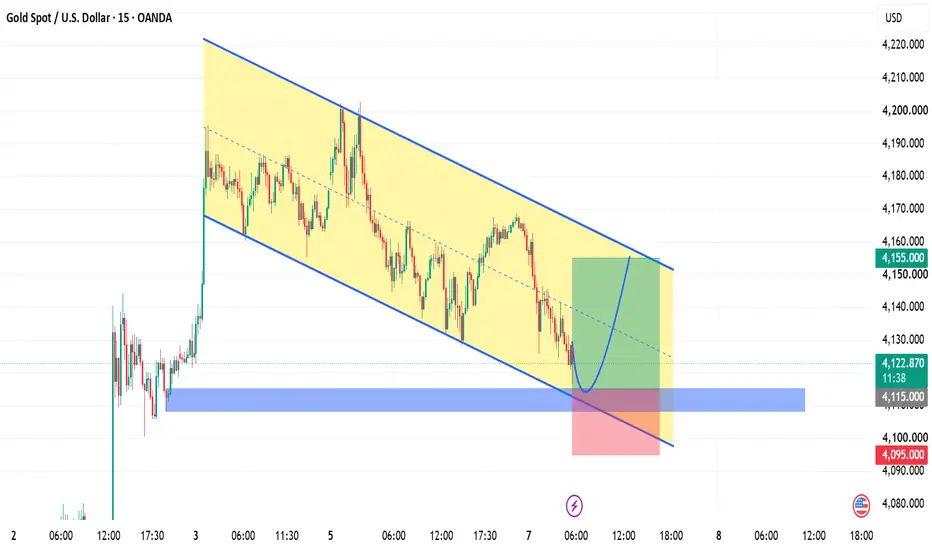
The chart shows price moving inside a descending channel, identified by two downward-sloping parallel trendlines.
This indicates that sellers have been in control, with the market forming lower highs and lower lows.
Support Zone
The blue highlighted area represents a demand/support zone where price has reacted previously.
As price reaches this area again, traders often monitor it for signs of buying interest or a potential bounce.
Channel Support Test
Price is currently testing the lower boundary of the descending channel.
When price reaches the edge of a channel, there are generally two educational scenarios:
Bounce Scenario: Buyers defend support, causing price to move back toward the middle or upper boundary of the channel.
Breakdown Scenario: Strong selling pressure pushes price below support, which may indicate continuation of the bearish trend.
Potential Rebound Idea
The blue curved arrow illustrates a possible bullish reaction from the support zone.
This is only a visual example of one potential outcome and does not guarantee that price will move higher.
Traders often wait for confirmation, such as:
Bullish candlestick patterns.
Higher lows on lower timeframes.
Increased buying volume.
A break above nearby resistance before considering a stronger bullish bias.
Risk Management Concept
The risk/reward box demonstrates the importance of planning before entering any trade.
Many traders define:
A clear invalidation level (stop-loss).
A logical profit target.
A favorable risk-to-reward ratio before taking any position.
Educational Summary
Trend: Bearish (descending channel).
Current Location: Price is testing a key support/demand zone near the lower channel boundary.
Bullish Possibility: A confirmed bounce could lead to a move toward the channel's midline or upper resistance.
Bearish Possibility: A decisive break below support may signal continuation of the downtrend.
The chart shows price moving inside a descending channel, identified by two downward-sloping parallel trendlines.
This indicates that sellers have been in control, with the market forming lower highs and lower lows.
Support Zone
The blue highlighted area represents a demand/support zone where price has reacted previously.
As price reaches this area again, traders often monitor it for signs of buying interest or a potential bounce.
Channel Support Test
Price is currently testing the lower boundary of the descending channel.
When price reaches the edge of a channel, there are generally two educational scenarios:
Bounce Scenario: Buyers defend support, causing price to move back toward the middle or upper boundary of the channel.
Breakdown Scenario: Strong selling pressure pushes price below support, which may indicate continuation of the bearish trend.
Potential Rebound Idea
The blue curved arrow illustrates a possible bullish reaction from the support zone.
This is only a visual example of one potential outcome and does not guarantee that price will move higher.
Traders often wait for confirmation, such as:
Bullish candlestick patterns.
Higher lows on lower timeframes.
Increased buying volume.
A break above nearby resistance before considering a stronger bullish bias.
Risk Management Concept
The risk/reward box demonstrates the importance of planning before entering any trade.
Many traders define:
A clear invalidation level (stop-loss).
A logical profit target.
A favorable risk-to-reward ratio before taking any position.
Educational Summary
Trend: Bearish (descending channel).
Current Location: Price is testing a key support/demand zone near the lower channel boundary.
Bullish Possibility: A confirmed bounce could lead to a move toward the channel's midline or upper resistance.
Bearish Possibility: A decisive break below support may signal continuation of the downtrend.

Join my Telegram for daily Forex & XAUUSD trading signals and market insights: t.me/ApexMarketExpert11
免責聲明
這些資訊和出版物並非旨在提供,也不構成TradingView提供或認可的任何形式的財務、投資、交易或其他類型的建議或推薦。請閱讀使用條款以了解更多資訊。
Join my Telegram for daily Forex & XAUUSD trading signals and market insights: t.me/ApexMarketExpert11
免責聲明
這些資訊和出版物並非旨在提供,也不構成TradingView提供或認可的任何形式的財務、投資、交易或其他類型的建議或推薦。請閱讀使用條款以了解更多資訊。