
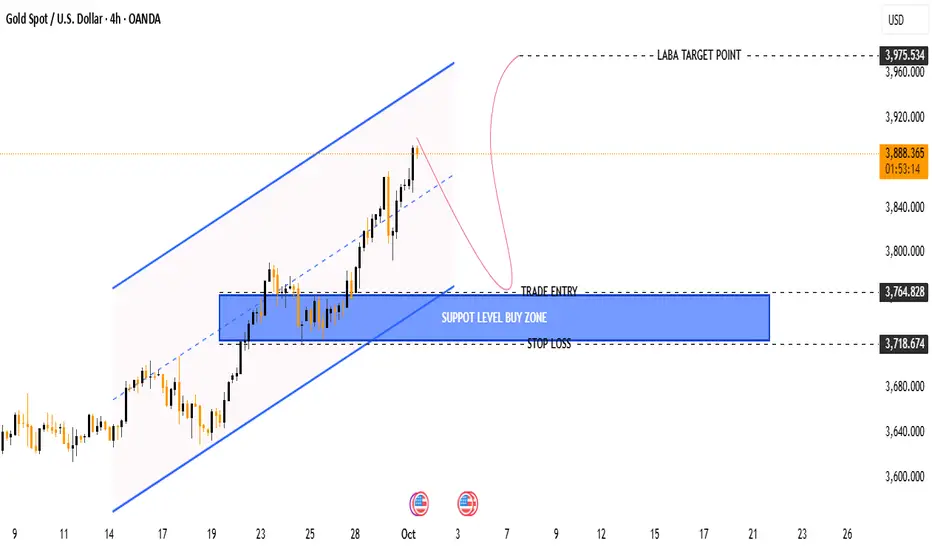
Analysis Overview:
📈 Trend:
The price is currently moving in an ascending channel, indicating a bullish trend.
Price has recently touched or slightly exceeded the upper boundary of the channel, suggesting a potential pullback.
🟦 Support Zone (Buy Zone):
Marked in blue, between 3,764.828 (Trade Entry) and 3,718.674 (Stop Loss).
This zone aligns with a previous consolidation area, which now acts as a strong support.
✅ Entry Plan:
Wait for price to retrace into the blue support zone.
Ideal entry around 3,764.828, possibly after a bullish signal (e.g., pin bar, bullish engulfing).
❌ Stop Loss:
Placed just below the support zone at 3,718.674, protecting the trade in case the structure fails.
🎯 Target (TP):
3,975.534 — This is labeled as the LABA TARGET POINT, near the upper boundary of the ascending channel.
Risk-reward ratio appears favorable, roughly 4:1 if using the full range between entry and stop loss.
🧠 Trade Idea Summary:
Setup Type: Pullback to Support in Bullish Channel
Bias: Long/Bullish
Entry Zone: 3,764.828 (support)
Stop Loss: 3,718.674 (below structure)
Target: 3,975.534 (channel top)
Conditions to Watch:
Confirm reversal within the buy zone before entering.
Monitor for bearish breakdown if price closes below stop loss zone.
⚠️ Risk Management Tips:
Use proper position sizing based on your account size and stop loss.
Do not enter early; wait for confirmation (e.g., bullish candle pattern) in the support zone.
Keep an eye on macroeconomic news (e.g., NFP, interest rate updates) as gold is very sensitive to these events
📈 Trend:
The price is currently moving in an ascending channel, indicating a bullish trend.
Price has recently touched or slightly exceeded the upper boundary of the channel, suggesting a potential pullback.
🟦 Support Zone (Buy Zone):
Marked in blue, between 3,764.828 (Trade Entry) and 3,718.674 (Stop Loss).
This zone aligns with a previous consolidation area, which now acts as a strong support.
✅ Entry Plan:
Wait for price to retrace into the blue support zone.
Ideal entry around 3,764.828, possibly after a bullish signal (e.g., pin bar, bullish engulfing).
❌ Stop Loss:
Placed just below the support zone at 3,718.674, protecting the trade in case the structure fails.
🎯 Target (TP):
3,975.534 — This is labeled as the LABA TARGET POINT, near the upper boundary of the ascending channel.
Risk-reward ratio appears favorable, roughly 4:1 if using the full range between entry and stop loss.
🧠 Trade Idea Summary:
Setup Type: Pullback to Support in Bullish Channel
Bias: Long/Bullish
Entry Zone: 3,764.828 (support)
Stop Loss: 3,718.674 (below structure)
Target: 3,975.534 (channel top)
Conditions to Watch:
Confirm reversal within the buy zone before entering.
Monitor for bearish breakdown if price closes below stop loss zone.
⚠️ Risk Management Tips:
Use proper position sizing based on your account size and stop loss.
Do not enter early; wait for confirmation (e.g., bullish candle pattern) in the support zone.
Keep an eye on macroeconomic news (e.g., NFP, interest rate updates) as gold is very sensitive to these events

join my telegram channel t.me/smartforexacademy45 t.me/smartforexacademy45
JOIN MY REFREL BROKER LINK one.exnessonelink.com/a/gissbq1h9c?source=app
JOIN MY REFREL BROKER LINK one.exnessonelink.com/a/gissbq1h9c?source=app
免責聲明
這些資訊和出版物並非旨在提供,也不構成TradingView提供或認可的任何形式的財務、投資、交易或其他類型的建議或推薦。請閱讀使用條款以了解更多資訊。
join my telegram channel t.me/smartforexacademy45 t.me/smartforexacademy45
JOIN MY REFREL BROKER LINK one.exnessonelink.com/a/gissbq1h9c?source=app
JOIN MY REFREL BROKER LINK one.exnessonelink.com/a/gissbq1h9c?source=app
免責聲明
這些資訊和出版物並非旨在提供,也不構成TradingView提供或認可的任何形式的財務、投資、交易或其他類型的建議或推薦。請閱讀使用條款以了解更多資訊。