
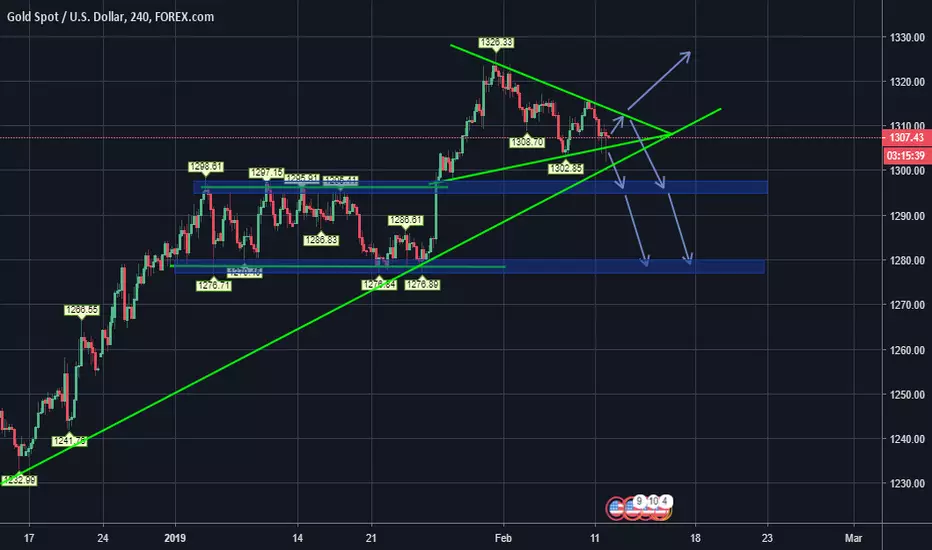
A pennant triangle has formed indicating that price action will break out either above market price or below.
Seeing as gold is currently trading at market highs, the stall in price action suggests it is losing bullish momentum and could therefore break downwards towards precious Support.
Or as due to the longer term bullish trend line it could continue higher to new structure highs and therefore continue bullish trend.
The blue arrows denote possible price action based on the Pennant pattern.
Seeing as gold is currently trading at market highs, the stall in price action suggests it is losing bullish momentum and could therefore break downwards towards precious Support.
Or as due to the longer term bullish trend line it could continue higher to new structure highs and therefore continue bullish trend.
The blue arrows denote possible price action based on the Pennant pattern.
註釋
Pennant broke Bullish.
免責聲明
這些資訊和出版物並非旨在提供,也不構成TradingView提供或認可的任何形式的財務、投資、交易或其他類型的建議或推薦。請閱讀使用條款以了解更多資訊。