
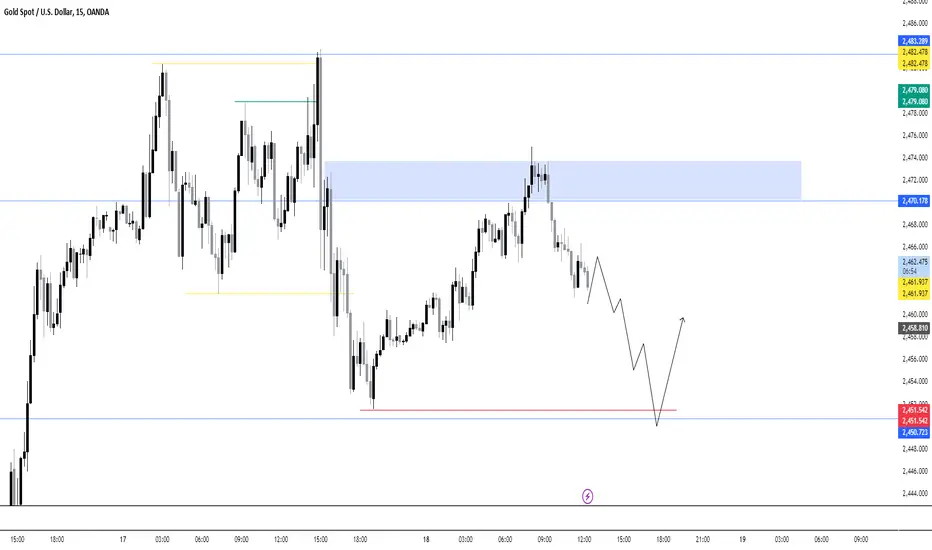
The blue highlighted area around the 2,470-2,479 level indicates a resistance zone where the price has previously faced selling pressure.
A key support level is marked by the red horizontal line around 2,450.723.
The price is showing a bearish trend, declining from the resistance zone, and is projected to drop further towards the support level before a potential rebound.
Consider entering a short position around the current price level (2,461.937) or upon confirmation of further bearish momentum.
Ensure proper risk management by setting stop losses and monitoring key levels for any invalidation of the bullish scenario.
A key support level is marked by the red horizontal line around 2,450.723.
The price is showing a bearish trend, declining from the resistance zone, and is projected to drop further towards the support level before a potential rebound.
Consider entering a short position around the current price level (2,461.937) or upon confirmation of further bearish momentum.
Ensure proper risk management by setting stop losses and monitoring key levels for any invalidation of the bullish scenario.

iSmashProfit
相關出版品
免責聲明
這些資訊和出版物並非旨在提供,也不構成TradingView提供或認可的任何形式的財務、投資、交易或其他類型的建議或推薦。請閱讀使用條款以了解更多資訊。