
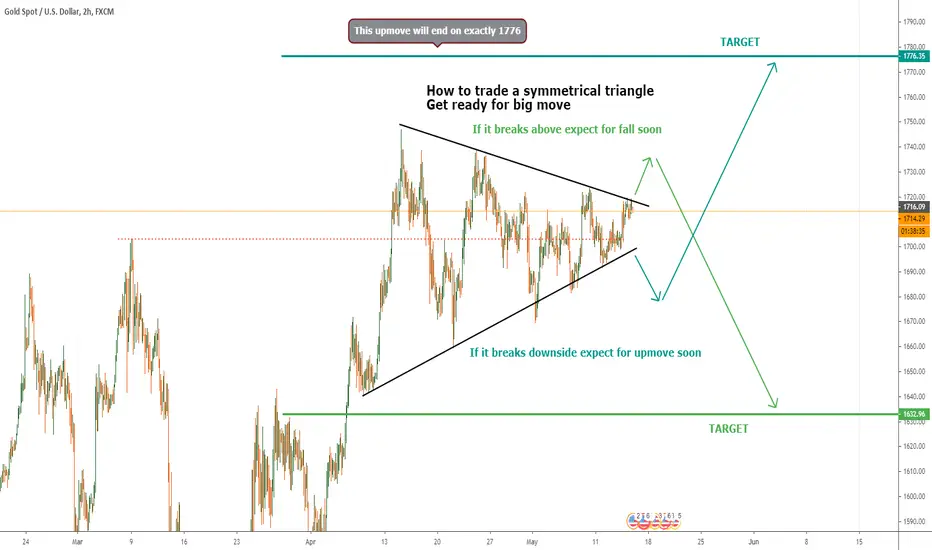
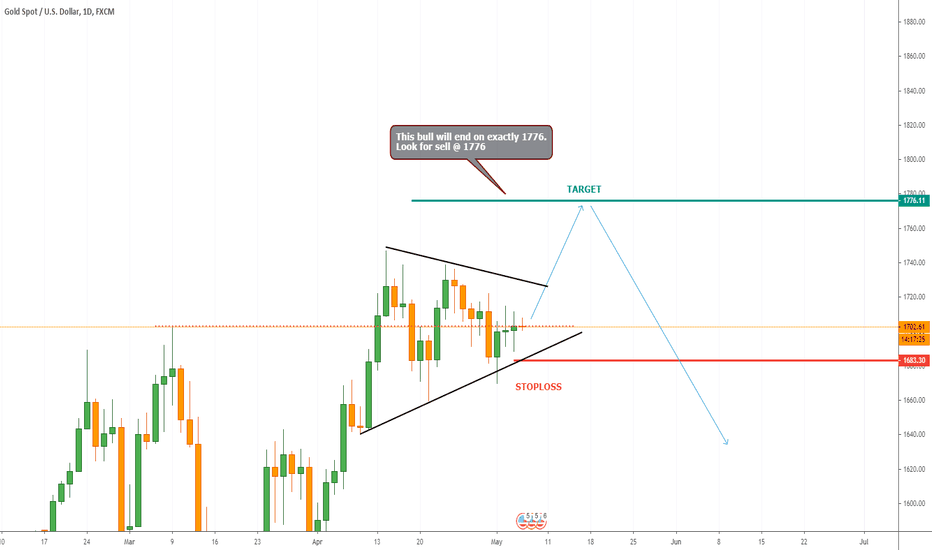
Hello traders! This is a chart to trade any symmetrical triangle. After the breakout to any side we will suddenly see huge buying or selling position, this huge pressure will change the direction to other side. According to my analysis i am expecting a breakdown and upmove to 1776. I have closed my previous buy position and waiting for confirmation.
Hit the like button if you find it helpful and informative and follow to catch the waves correctly.
Previous analysis
Hit the like button if you find it helpful and informative and follow to catch the waves correctly.
Previous analysis

免責聲明
這些資訊和出版物並非旨在提供,也不構成TradingView提供或認可的任何形式的財務、投資、交易或其他類型的建議或推薦。請閱讀使用條款以了解更多資訊。
免責聲明
這些資訊和出版物並非旨在提供,也不構成TradingView提供或認可的任何形式的財務、投資、交易或其他類型的建議或推薦。請閱讀使用條款以了解更多資訊。