
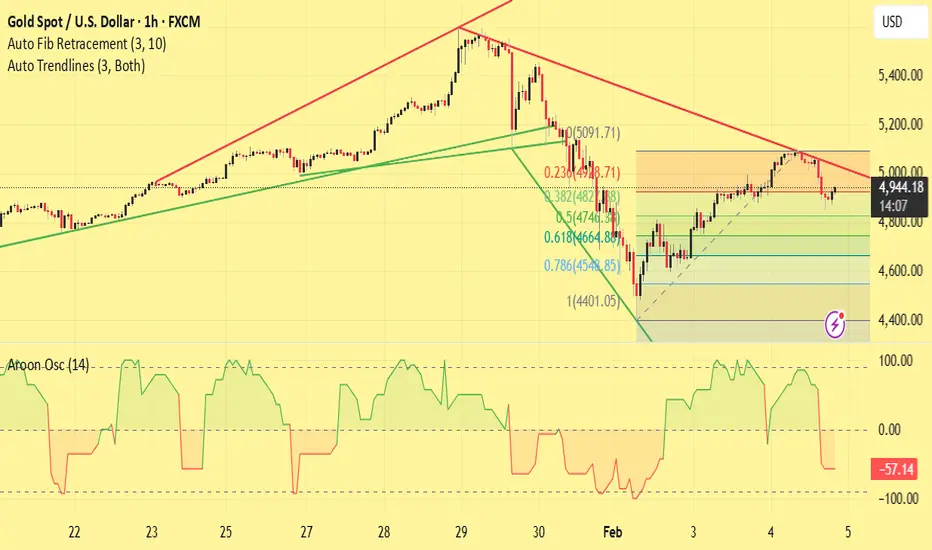
Gold (XAUUSD) on the 1-hour timeframe remains within a broader bullish structure, but price is currently undergoing a corrective phase. After reaching a major swing high, the market faced strong rejection from the descending red trendline, triggering a sharp pullback.
The recent decline respected the Fibonacci retracement zone, with price reacting strongly between the 0.618–0.786 levels, indicating active demand from buyers. This zone aligns with prior structure support, reinforcing its technical significance. The recovery from the lows shows higher lows, suggesting short-term bullish intent, though momentum is slowing near resistance.
Price is now trading below the descending trendline and near the upper Fibonacci retracement area, where sellers are showing interest. A clear break and hold above the trendline would open the door for a continuation toward the previous highs. Conversely, rejection from this area could lead to another retest of the mid or lower Fibonacci support levels.
The Aroon Oscillator is turning negative, signaling weakening bullish momentum and increasing risk of consolidation or a short-term pullback before the next directional move.
Key Levels to Watch:
Resistance: Descending trendline / recent swing high zone
Support: 0.618–0.786 Fibonacci retracement area
Bias: Neutral to cautiously bullish while above key support
This setup favors patience—waiting for either a confirmed breakout above resistance or a bullish reaction from support for higher-probability entries.
The recent decline respected the Fibonacci retracement zone, with price reacting strongly between the 0.618–0.786 levels, indicating active demand from buyers. This zone aligns with prior structure support, reinforcing its technical significance. The recovery from the lows shows higher lows, suggesting short-term bullish intent, though momentum is slowing near resistance.
Price is now trading below the descending trendline and near the upper Fibonacci retracement area, where sellers are showing interest. A clear break and hold above the trendline would open the door for a continuation toward the previous highs. Conversely, rejection from this area could lead to another retest of the mid or lower Fibonacci support levels.
The Aroon Oscillator is turning negative, signaling weakening bullish momentum and increasing risk of consolidation or a short-term pullback before the next directional move.
Key Levels to Watch:
Resistance: Descending trendline / recent swing high zone
Support: 0.618–0.786 Fibonacci retracement area
Bias: Neutral to cautiously bullish while above key support
This setup favors patience—waiting for either a confirmed breakout above resistance or a bullish reaction from support for higher-probability entries.
交易進行
hello guyz who made a profit
t.me/wolfpipsspot
Sharing My Exprience Here And providing Daily Forex Ideas t.me/wolfpipsspot Free Signal's Analysis Chart Mapping
Don't Worry Friend's I'm Here For Your Help ❤️ t.me/wolfpipsspot
Sharing My Exprience Here And providing Daily Forex Ideas t.me/wolfpipsspot Free Signal's Analysis Chart Mapping
Don't Worry Friend's I'm Here For Your Help ❤️ t.me/wolfpipsspot
免責聲明
這些資訊和出版物並非旨在提供,也不構成TradingView提供或認可的任何形式的財務、投資、交易或其他類型的建議或推薦。請閱讀使用條款以了解更多資訊。
t.me/wolfpipsspot
Sharing My Exprience Here And providing Daily Forex Ideas t.me/wolfpipsspot Free Signal's Analysis Chart Mapping
Don't Worry Friend's I'm Here For Your Help ❤️ t.me/wolfpipsspot
Sharing My Exprience Here And providing Daily Forex Ideas t.me/wolfpipsspot Free Signal's Analysis Chart Mapping
Don't Worry Friend's I'm Here For Your Help ❤️ t.me/wolfpipsspot
免責聲明
這些資訊和出版物並非旨在提供,也不構成TradingView提供或認可的任何形式的財務、投資、交易或其他類型的建議或推薦。請閱讀使用條款以了解更多資訊。