
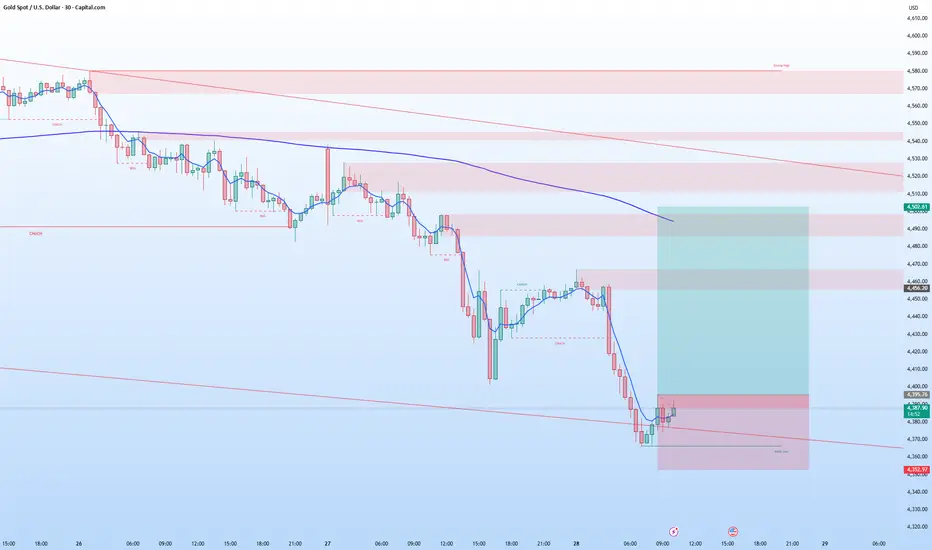
Gold is starting to show the first signs that the aggressive bearish impulse may be nearing completion, at least temporarily.
After the liquidity sweep and completion of the downside impulse, price is now beginning to build the first bullish reactions from a major discount zone.
📌 What I currently see:
possible Elliott Wave (5) completion
strong reaction from demand
first local bullish CHoCH
short-term EMA5 reclaim
weakening bearish momentum
reaction exactly from the Fib 0.618–0.65 zone
At this stage, we still do NOT have a confirmed HTF reversal, but the structure is starting to look more like:
“bearish exhaustion + beginning of a retracement”.
📌 What I’m watching next:
acceptance above 4395–4415
clear bullish H1 BOS
holding above EMA5 after pullbacks
nearby FVG fills
continuation of structure recovery
If these confirmations appear, then higher zones and the EMA200 may become the next price magnets.
⚠️ Invalidation:
aggressive move back below the current lows and loss of the newly formed structure.
📌 For now:
the market is starting to show the first real signs that sellers may be losing short-term control.
After the liquidity sweep and completion of the downside impulse, price is now beginning to build the first bullish reactions from a major discount zone.
📌 What I currently see:
possible Elliott Wave (5) completion
strong reaction from demand
first local bullish CHoCH
short-term EMA5 reclaim
weakening bearish momentum
reaction exactly from the Fib 0.618–0.65 zone
At this stage, we still do NOT have a confirmed HTF reversal, but the structure is starting to look more like:
“bearish exhaustion + beginning of a retracement”.
📌 What I’m watching next:
acceptance above 4395–4415
clear bullish H1 BOS
holding above EMA5 after pullbacks
nearby FVG fills
continuation of structure recovery
If these confirmations appear, then higher zones and the EMA200 may become the next price magnets.
⚠️ Invalidation:
aggressive move back below the current lows and loss of the newly formed structure.
📌 For now:
the market is starting to show the first real signs that sellers may be losing short-term control.
註釋
註釋
手動結束交易
XAUUSD — 0.5 Retracement Reached ✔️TP1 reached ✔️
TP2 reached ✔️
The move successfully reached the 0.5 Fibonacci retracement zone, exactly from the previously discussed reaction and discount area.
Price respected the short-term bullish structure very well and is now reacting directly into the EMA200 + intraday resistance zone.
From here, it becomes important to watch:
continuation above the EMA200
or a possible reaction / distribution from this premium area
註釋
Well done!
免責聲明
這些資訊和出版物並非旨在提供,也不構成TradingView提供或認可的任何形式的財務、投資、交易或其他類型的建議或推薦。請閱讀使用條款以了解更多資訊。
免責聲明
這些資訊和出版物並非旨在提供,也不構成TradingView提供或認可的任何形式的財務、投資、交易或其他類型的建議或推薦。請閱讀使用條款以了解更多資訊。