
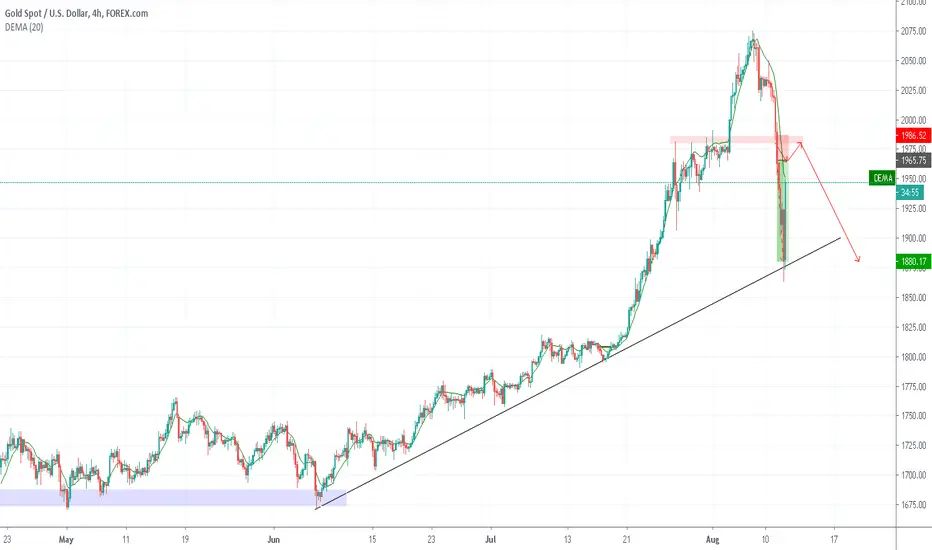
PERFECT TREND YESTERDAY TARGET REACH PROPER HIGHER HIGH
The Perfect Trend Line indicator act as a trend following indicator. It is simply made of 2 lines from highest high and lowest low of 2 different periods, one short and a longer one.
If the price breaches the longest line, it is a sign a of potential trend reversal, while if price is in the cloud made of these 2 lines, it is only a retracement and a potential price rebound in the same direction as the main trend.
Confirmation of trend reversal are highlighted with blue and red dots.
The cloud can be expanded with the SlowPipDisplace and the FastPipDisplace settings which must be set in points/pips values.

免責聲明
這些資訊和出版物並非旨在提供,也不構成TradingView提供或認可的任何形式的財務、投資、交易或其他類型的建議或推薦。請閱讀使用條款以了解更多資訊。