📚 Method used:
This overview is based on the “Near and Far Retests: What Every Trader Should Know” approach.
The logic behind this structure is explained in more detail in my educational material, which you can find in Related ideas.
🌍 Market context:
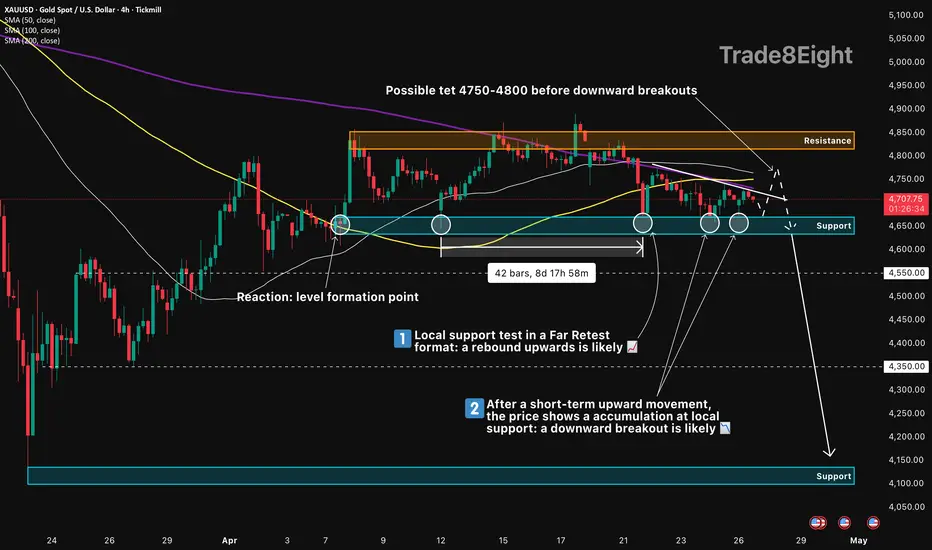
XAUUSD is currently trading near a local support area after moving down from the previous resistance zone. The chart shows that this support has already acted as an important reaction area several times, which makes it a key decision point for the market.
The current structure looks like a Far Retest of the support zone: price returns to an important level after some distance and may react from it again.
At the same time, the chart also shows a possible short-term rebound toward the 4750–4800 area before the market decides whether to continue lower.
This makes the current support zone important for reading the next market intention.
📈 Bullish scenario:
A bullish scenario may develop if XAUUSD reacts from the local support zone and forms a rebound.
A false breakout below support followed by a recovery back above the zone could also show that buyers are still defending this area.
📉 Bearish scenario (priority):
A bearish scenario may develop if price starts accumulating near the support zone instead of producing a clean rebound.
If XAUUSD continues to hold around this area and pressure remains, a downward breakout of the local support may become more likely.
📌 Bottom line:
This is an important reaction area.
The market is near a support-based decision point, and the next reaction will be important for understanding whether XAUUSD rebounds first or prepares for a deeper move lower.
If this overview was useful, feel free to boost 🚀 it and share your view in the comments 💬
交易進行
The price has now broken through 4650 (a key short-term support level). A stop at 4600 is likely soon. Medium-term mood remains in favor of sellers, but a test of 4700-4800 is not out of the question, especially given tomorrow's Fed meeting.註釋
🚀 +114 points 🔥Ahead of the Fed's interest rate decision,
 XAUUSD looks poised for continued decline. Volatility, which could trigger upward movements, is possible, but the main priority for now is selling. Targets are 4400 and 4100.
註釋
GOLD is highly likely to test the 4750-4800 price area. Therefore, it's likely best to consider short- and medium-term sell trades conservatively.註釋
Another hot phase between the US and Iran in the Middle East has caused the US dollar to strengthen.GOLD is expected to actively test the 4500 area in the very near future.The idea of a global decline is still valid.

⚠️ Public market view only. Not financial advice. DYOR and manage your own risk.
相關出版品
免責聲明
這些資訊和出版物並非旨在提供,也不構成TradingView提供或認可的任何形式的財務、投資、交易或其他類型的建議或推薦。請閱讀使用條款以了解更多資訊。
⚠️ Public market view only. Not financial advice. DYOR and manage your own risk.
相關出版品
免責聲明
這些資訊和出版物並非旨在提供,也不構成TradingView提供或認可的任何形式的財務、投資、交易或其他類型的建議或推薦。請閱讀使用條款以了解更多資訊。