
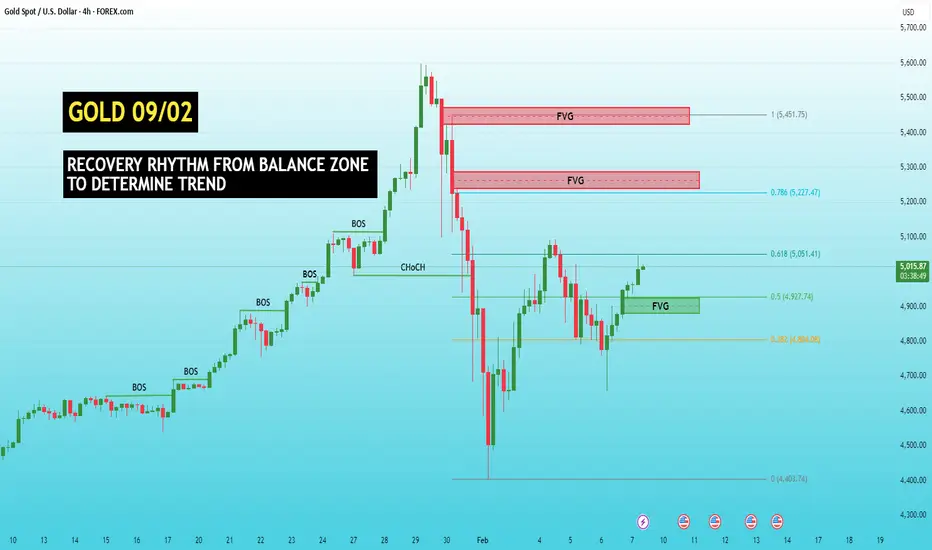
Gold prices are recovering from a low balance zone after a strong sell-off at the beginning of the month. However, this is not yet a confirmation of a return to an uptrend, but rather a revaluation process in a broken structure. The current H4 is in a decisive zone: recovering to continue the decline or having enough strength to reclaim the old structure.
MACRO CONTEXT – WHAT IS THE CASH FLOW THINKING?
The USD maintains its strength thanks to stable US economic data and expectations that the Fed will not rush to ease.
US bond yields remain high → continue to pressure gold in the medium term.
Geopolitical risks still exist, but cash flow has not returned to safe havens, indicating that the market prioritizes cash flow and yields over defense.
➡️ Result:
Gold has a technical rebound, but there is no strong enough catalyst to reverse the H4 trend.
H4 TECHNICAL STRUCTURE – WHAT THE MARKET IS DOING
The previous uptrend has been broken (CHoCH down).
The current recovery is just a pullback in the down structure.
Prices are operating between Fibonacci + FVG, where the market often "reveals its hand."
ROUTE MAP – KEY PRICE ZONES TO WATCH
🔴 UPPER ZONE – SELL REACTION / RESISTANCE
5050 – 5100
Fib 0.618
Technical recovery zone in the down structure
→ If prices reach this zone but are not accepted, the recovery is likely to end.
5220 – 5300
FVG H4 + Fib 0.786
→ Only when holding above this zone will the bearish H4 scenario be invalidated.
🟢 LOWER ZONE – BUY REACTION / SUPPORT
4920 – 4950
Fib 0.5 + FVG
→ Balance zone, likely to see two-way reactions – prioritize observing price reactions.
4800 – 4850
Fib 0.382 + demand H4
→ Important support zone if selling pressure returns.
4600 – 4400
Liquidity low
→ Only activated if the down structure expands.
HOW LUCASGRAY VIEWS THE CURRENT MARKET
News creates short-term volatility,
But the H4 structure is what determines the direction.
We do not chase prices.
We wait for the market to react at high confluence zones to distinguish:
technical recovery rhythm (intraday scalp)
or acceptance of the structure for the next swing.
The most beautiful upward rhythms are often where the market "traps emotions."
The truth always lies in the price zone that the market dares to hold or not.
Upcoming updates will focus on actual price reactions at marked zones.
Follow to not miss scalp zones and important structure pivot points this week.
— LucasGrayTrading
MACRO CONTEXT – WHAT IS THE CASH FLOW THINKING?
The USD maintains its strength thanks to stable US economic data and expectations that the Fed will not rush to ease.
US bond yields remain high → continue to pressure gold in the medium term.
Geopolitical risks still exist, but cash flow has not returned to safe havens, indicating that the market prioritizes cash flow and yields over defense.
➡️ Result:
Gold has a technical rebound, but there is no strong enough catalyst to reverse the H4 trend.
H4 TECHNICAL STRUCTURE – WHAT THE MARKET IS DOING
The previous uptrend has been broken (CHoCH down).
The current recovery is just a pullback in the down structure.
Prices are operating between Fibonacci + FVG, where the market often "reveals its hand."
ROUTE MAP – KEY PRICE ZONES TO WATCH
🔴 UPPER ZONE – SELL REACTION / RESISTANCE
5050 – 5100
Fib 0.618
Technical recovery zone in the down structure
→ If prices reach this zone but are not accepted, the recovery is likely to end.
5220 – 5300
FVG H4 + Fib 0.786
→ Only when holding above this zone will the bearish H4 scenario be invalidated.
🟢 LOWER ZONE – BUY REACTION / SUPPORT
4920 – 4950
Fib 0.5 + FVG
→ Balance zone, likely to see two-way reactions – prioritize observing price reactions.
4800 – 4850
Fib 0.382 + demand H4
→ Important support zone if selling pressure returns.
4600 – 4400
Liquidity low
→ Only activated if the down structure expands.
HOW LUCASGRAY VIEWS THE CURRENT MARKET
News creates short-term volatility,
But the H4 structure is what determines the direction.
We do not chase prices.
We wait for the market to react at high confluence zones to distinguish:
technical recovery rhythm (intraday scalp)
or acceptance of the structure for the next swing.
The most beautiful upward rhythms are often where the market "traps emotions."
The truth always lies in the price zone that the market dares to hold or not.
Upcoming updates will focus on actual price reactions at marked zones.
Follow to not miss scalp zones and important structure pivot points this week.
— LucasGrayTrading

Daily trend & Supply/Demand insights 📊
👉 t.me/+cZC_DmEr3OwzOTA1
High-probability zones & structured setups
Clear scenarios for better decision-making
Trade smarter with LucasGrayTrading 🎖
👉 t.me/+cZC_DmEr3OwzOTA1
High-probability zones & structured setups
Clear scenarios for better decision-making
Trade smarter with LucasGrayTrading 🎖
免責聲明
這些資訊和出版物並非旨在提供,也不構成TradingView提供或認可的任何形式的財務、投資、交易或其他類型的建議或推薦。請閱讀使用條款以了解更多資訊。
Daily trend & Supply/Demand insights 📊
👉 t.me/+cZC_DmEr3OwzOTA1
High-probability zones & structured setups
Clear scenarios for better decision-making
Trade smarter with LucasGrayTrading 🎖
👉 t.me/+cZC_DmEr3OwzOTA1
High-probability zones & structured setups
Clear scenarios for better decision-making
Trade smarter with LucasGrayTrading 🎖
免責聲明
這些資訊和出版物並非旨在提供,也不構成TradingView提供或認可的任何形式的財務、投資、交易或其他類型的建議或推薦。請閱讀使用條款以了解更多資訊。