
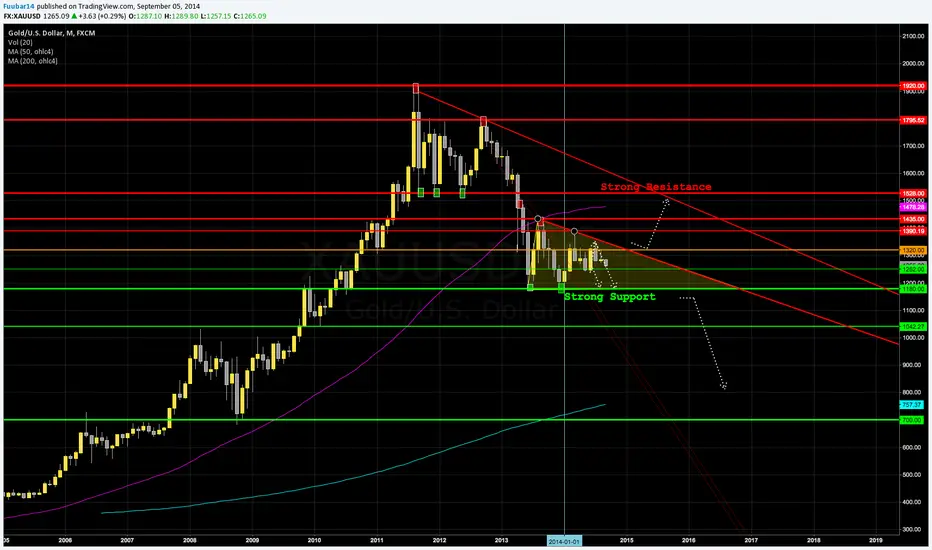
Looking at the monthly chart we see a strong support at 1180 USD forming the lower side of the descending triangle with the downwards trend line on top.
If the support at 1040 USD falls, lower targets get activated. 1042 could be a short stop an its way down to levels around 800 USD or even more likely 700 USD.
If price breaks through the upper trend line, higher targets would be activated and some resistance levels must be passed to reach the stronger resistance at 1528 USD.
If the support at 1040 USD falls, lower targets get activated. 1042 could be a short stop an its way down to levels around 800 USD or even more likely 700 USD.
If price breaks through the upper trend line, higher targets would be activated and some resistance levels must be passed to reach the stronger resistance at 1528 USD.

免責聲明
這些資訊和出版物並非旨在提供,也不構成TradingView提供或認可的任何形式的財務、投資、交易或其他類型的建議或推薦。請閱讀使用條款以了解更多資訊。