
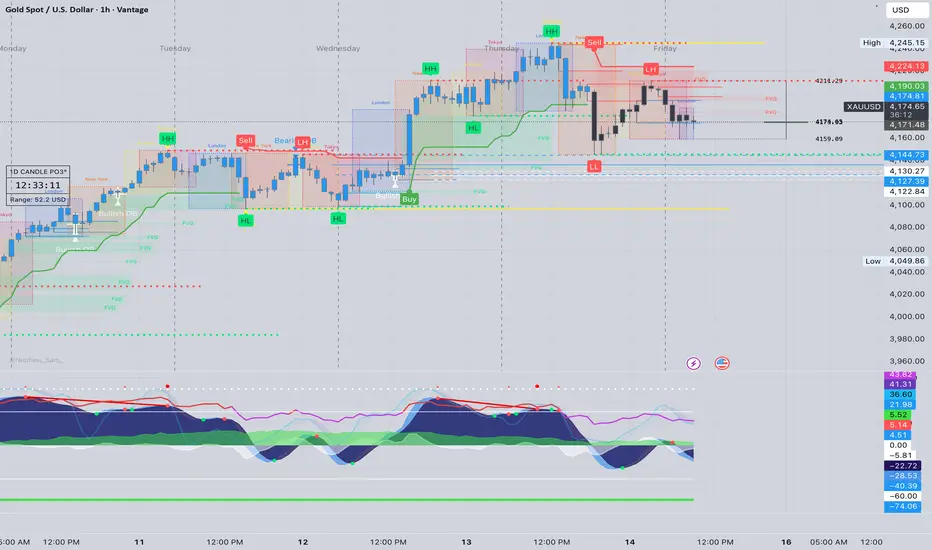
1️⃣ Market Overview
Gold begins the London session trading around $4,178–$4,183, recovering after an early sweep toward $4,159 and bouncing back into the intraday structure.
Despite this recovery, price remains below the broken ascending trendline, which now acts as resistance, and under the broader descending trendline from $4,245.
The current movement suggests a corrective pullback, with sellers defending the $4,183–$4,192 zone, as gold forms lower highs intraday. London volatility will determine whether the market rejects this retest (bearish continuation) or breaks above it (bullish reversal attempt).
⸻
2️⃣ Technical Breakdown
🔹 Daily (D1)
• Gold maintains a mid-recovery structure, holding above the 100EMA and trying to build above the 10EMA.
• RSI ~61 shows mild bullish momentum but not strong enough to break the long-term descending trendline.
• Major support remains at $4,028–$4,090, with resistance at the compression ceiling near $4,192–$4,209.
🔹 1H Chart
• Structure remains bearish-to-neutral, following a clean BOS down from $4,209 into $4,159.
• Current bounce is just a retest of the broken trendline.
• RSI around 46 and MACD red but flattening → early signs of indecision, not reversal.
• Critical resistance sits at $4,183–$4,192, aligned with retest structure + EMA cluster.
🔹 15M–5M
• Intraday shows a BOS to the downside, then a corrective pullback.
• Price is reacting inside a tight compression wedge between trendline resistance and EMAs.
• Momentum on lower timeframes suggests sellers are waiting for rejection confirmation at $4,183–$4,192.
⸻
3️⃣ Fibonacci Analysis
Last swing: 4,245 → 4,159
• 38.2% = 4,192
• 50.0% = 4,202
• 61.8% = 4,212
🎯 Golden Zone: 4,192 – 4,212
This is the primary high-probability sell interest area.
⸻
4️⃣ High-Probability Trade Scenarios
📉 SELL SCENARIO (Main Bias)
Sell Zone: 4,183 – 4,192
(Trendline retest + EMA cluster + FVG alignment)
Targets:
→ 4,172
→ 4,160
→ 4,145
Stop Loss: Above 4,200
Confirmation Needed:
• Bearish engulfing
• BOS below 4,176
• RSI divergence on 5M–15M
⸻
💥 BREAKOUT SELL SETUP
Trigger: Break & close below 4,172
Retest: 4,174–4,176
Targets:
→ 4,160
→ 4,145
→ 4,130
Stop Loss: Above 4,185
⸻
📈 BUY SCENARIO (Countertrend)
Buy Zone: 4,159 – 4,165
(Morning sweep demand + liquidity grab)
Targets:
→ 4,176
→ 4,183
→ 4,190
Stop Loss: Below 4,154
Confirmation:
• Bullish CHoCH
• Strong wick rejection
• MACD flip
⸻
💥 BREAKOUT BUY SETUP
Trigger: Break & close above 4,200
Retest: 4,192–4,195
Targets:
→ 4,209
→ 4,225
→ 4,245
Stop Loss: Below 4,188
⸻
5️⃣ Fundamental Watch
• London session opens with higher volatility following overnight sweeps.
• US PPI and consumer sentiment later today may set the direction for the next leg.
• DXY stabilizing near 105.8, keeping pressure on gold until broken.
• Markets remain sensitive to Fed tone and bond yield fluctuation.
⸻
6️⃣ Key Technical Levels
Resistance Zones:
• 4,183
• 4,192
• 4,200
• 4,209
Support Zones:
• 4,172
• 4,165
• 4,159
• 4,145
Golden Zone:
➡️ 4,192 – 4,212
Break Levels:
• Sell Break Trigger: < 4,172
• Buy Break Trigger: > 4,200
⸻
7️⃣ Analyst Summary
Gold is forming a corrective pullback into a major confluence zone.
As long as gold remains below 4,190, the market favors bearish continuation toward 4,160 → 4,145.
A breakout above 4,200 would invalidate the bearish structure and drive the market toward the 4,225–4,245 imbalance.
This is a classic London-session compression → expansion setup.
⸻
8️⃣ Final Bias Summary
📉 Primary Bias: Bearish below 4,190, targeting 4,160 – 4,145.
📈 Alternative Bias: Bullish only above 4,200, targeting 4,225 – 4,245.
⸻
Gold begins the London session trading around $4,178–$4,183, recovering after an early sweep toward $4,159 and bouncing back into the intraday structure.
Despite this recovery, price remains below the broken ascending trendline, which now acts as resistance, and under the broader descending trendline from $4,245.
The current movement suggests a corrective pullback, with sellers defending the $4,183–$4,192 zone, as gold forms lower highs intraday. London volatility will determine whether the market rejects this retest (bearish continuation) or breaks above it (bullish reversal attempt).
⸻
2️⃣ Technical Breakdown
🔹 Daily (D1)
• Gold maintains a mid-recovery structure, holding above the 100EMA and trying to build above the 10EMA.
• RSI ~61 shows mild bullish momentum but not strong enough to break the long-term descending trendline.
• Major support remains at $4,028–$4,090, with resistance at the compression ceiling near $4,192–$4,209.
🔹 1H Chart
• Structure remains bearish-to-neutral, following a clean BOS down from $4,209 into $4,159.
• Current bounce is just a retest of the broken trendline.
• RSI around 46 and MACD red but flattening → early signs of indecision, not reversal.
• Critical resistance sits at $4,183–$4,192, aligned with retest structure + EMA cluster.
🔹 15M–5M
• Intraday shows a BOS to the downside, then a corrective pullback.
• Price is reacting inside a tight compression wedge between trendline resistance and EMAs.
• Momentum on lower timeframes suggests sellers are waiting for rejection confirmation at $4,183–$4,192.
⸻
3️⃣ Fibonacci Analysis
Last swing: 4,245 → 4,159
• 38.2% = 4,192
• 50.0% = 4,202
• 61.8% = 4,212
🎯 Golden Zone: 4,192 – 4,212
This is the primary high-probability sell interest area.
⸻
4️⃣ High-Probability Trade Scenarios
📉 SELL SCENARIO (Main Bias)
Sell Zone: 4,183 – 4,192
(Trendline retest + EMA cluster + FVG alignment)
Targets:
→ 4,172
→ 4,160
→ 4,145
Stop Loss: Above 4,200
Confirmation Needed:
• Bearish engulfing
• BOS below 4,176
• RSI divergence on 5M–15M
⸻
💥 BREAKOUT SELL SETUP
Trigger: Break & close below 4,172
Retest: 4,174–4,176
Targets:
→ 4,160
→ 4,145
→ 4,130
Stop Loss: Above 4,185
⸻
📈 BUY SCENARIO (Countertrend)
Buy Zone: 4,159 – 4,165
(Morning sweep demand + liquidity grab)
Targets:
→ 4,176
→ 4,183
→ 4,190
Stop Loss: Below 4,154
Confirmation:
• Bullish CHoCH
• Strong wick rejection
• MACD flip
⸻
💥 BREAKOUT BUY SETUP
Trigger: Break & close above 4,200
Retest: 4,192–4,195
Targets:
→ 4,209
→ 4,225
→ 4,245
Stop Loss: Below 4,188
⸻
5️⃣ Fundamental Watch
• London session opens with higher volatility following overnight sweeps.
• US PPI and consumer sentiment later today may set the direction for the next leg.
• DXY stabilizing near 105.8, keeping pressure on gold until broken.
• Markets remain sensitive to Fed tone and bond yield fluctuation.
⸻
6️⃣ Key Technical Levels
Resistance Zones:
• 4,183
• 4,192
• 4,200
• 4,209
Support Zones:
• 4,172
• 4,165
• 4,159
• 4,145
Golden Zone:
➡️ 4,192 – 4,212
Break Levels:
• Sell Break Trigger: < 4,172
• Buy Break Trigger: > 4,200
⸻
7️⃣ Analyst Summary
Gold is forming a corrective pullback into a major confluence zone.
As long as gold remains below 4,190, the market favors bearish continuation toward 4,160 → 4,145.
A breakout above 4,200 would invalidate the bearish structure and drive the market toward the 4,225–4,245 imbalance.
This is a classic London-session compression → expansion setup.
⸻
8️⃣ Final Bias Summary
📉 Primary Bias: Bearish below 4,190, targeting 4,160 – 4,145.
📈 Alternative Bias: Bullish only above 4,200, targeting 4,225 – 4,245.
⸻

— ElDoradoFx PREMIUM 3.0 Team 🚀
免責聲明
這些資訊和出版物並非旨在提供,也不構成TradingView提供或認可的任何形式的財務、投資、交易或其他類型的建議或推薦。請閱讀使用條款以了解更多資訊。
— ElDoradoFx PREMIUM 3.0 Team 🚀
免責聲明
這些資訊和出版物並非旨在提供,也不構成TradingView提供或認可的任何形式的財務、投資、交易或其他類型的建議或推薦。請閱讀使用條款以了解更多資訊。