
✅ Technical Analysis Breakdown (XAUUSD – 1H Chart)
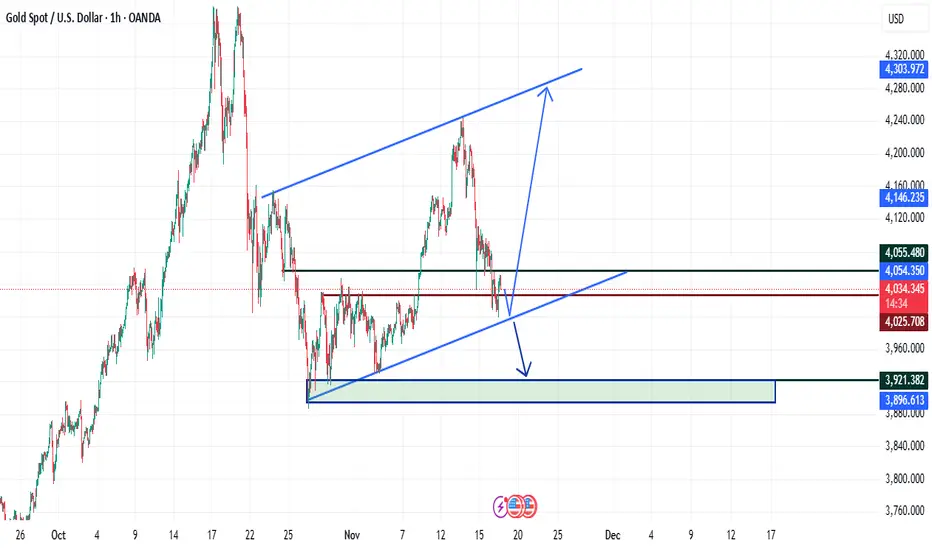
gold chart shows a rising wedge / ascending channel, and price is currently reacting at the mid-range support.
You’ve drawn two potential outcomes – continuation upward or bearish breakdown. Let’s analyze both with precision.
📌 1. Current Market Structure
Price is inside a large upward channel.
It recently rejected from the upper trendline, pulling back toward the mid-channel support.
Price is now sitting near the horizontal support zone ~ 4045–4034.
This is a reaction zone where the next direction should become clear.
📈 2. Bullish Scenario (Bounce & Rally Toward 4250+)
Conditions for upside:
Price must break and hold above 4055 (you marked this level).
Bullish structure resumes with higher lows.
Target moves:
1st target: 4160
2nd target: 4250
3rd target: Retest of the channel top near 4300–4330
Your blue arrow upward matches this exact pathway.
Why this can happen:
Price still respecting the ascending channel.
Mid-channel support is holding.
Buyers may step in near support.
📉 3. Bearish Scenario (Breakdown to 3920–3890 Zone)
This becomes active only if price breaks below the rising trendline around 4020–4010.
Bearish targets:
1st target: 3980
2nd target: 3920–3890 (your green demand zone)
This is a strong liquidity pool where buyers previously entered.
Your downward arrow correctly points toward this demand zone.
Why this can happen:
Rising wedge patterns often break down.
Momentum is currently weakening.
Massive liquidity below 4000.
🎯 4. What Is Most Likely Right Now?
Based on the chart:
✔ Price is testing support.
✔ Still inside the bullish channel.
✔ No confirmed breakdown yet.
➡ Bias: Short-term bullish unless 4020 breaks.
Once 4020 breaks cleanly → bearish continuation becomes very likely.
🧭 5. Simple Trading Plan (Based on Your Zones)
Bullish Setup
Buy above: 4055
SL: 4020
TP: 4160 → 4250 → 4320
Bearish Setup
Sell after breakdown below: 4020
SL: 4050
TP: 3980 → 3920 → 3890
For More Updates Stay Tuned
gold chart shows a rising wedge / ascending channel, and price is currently reacting at the mid-range support.
You’ve drawn two potential outcomes – continuation upward or bearish breakdown. Let’s analyze both with precision.
📌 1. Current Market Structure
Price is inside a large upward channel.
It recently rejected from the upper trendline, pulling back toward the mid-channel support.
Price is now sitting near the horizontal support zone ~ 4045–4034.
This is a reaction zone where the next direction should become clear.
📈 2. Bullish Scenario (Bounce & Rally Toward 4250+)
Conditions for upside:
Price must break and hold above 4055 (you marked this level).
Bullish structure resumes with higher lows.
Target moves:
1st target: 4160
2nd target: 4250
3rd target: Retest of the channel top near 4300–4330
Your blue arrow upward matches this exact pathway.
Why this can happen:
Price still respecting the ascending channel.
Mid-channel support is holding.
Buyers may step in near support.
📉 3. Bearish Scenario (Breakdown to 3920–3890 Zone)
This becomes active only if price breaks below the rising trendline around 4020–4010.
Bearish targets:
1st target: 3980
2nd target: 3920–3890 (your green demand zone)
This is a strong liquidity pool where buyers previously entered.
Your downward arrow correctly points toward this demand zone.
Why this can happen:
Rising wedge patterns often break down.
Momentum is currently weakening.
Massive liquidity below 4000.
🎯 4. What Is Most Likely Right Now?
Based on the chart:
✔ Price is testing support.
✔ Still inside the bullish channel.
✔ No confirmed breakdown yet.
➡ Bias: Short-term bullish unless 4020 breaks.
Once 4020 breaks cleanly → bearish continuation becomes very likely.
🧭 5. Simple Trading Plan (Based on Your Zones)
Bullish Setup
Buy above: 4055
SL: 4020
TP: 4160 → 4250 → 4320
Bearish Setup
Sell after breakdown below: 4020
SL: 4050
TP: 3980 → 3920 → 3890
For More Updates Stay Tuned
交易進行
h1 candle breakout 4055 dont miss buying opportunity 交易結束:目標達成
1st target achived dont miss more updates stay alert
免責聲明
這些資訊和出版物並非旨在提供,也不構成TradingView提供或認可的任何形式的財務、投資、交易或其他類型的建議或推薦。請閱讀使用條款以了解更多資訊。