
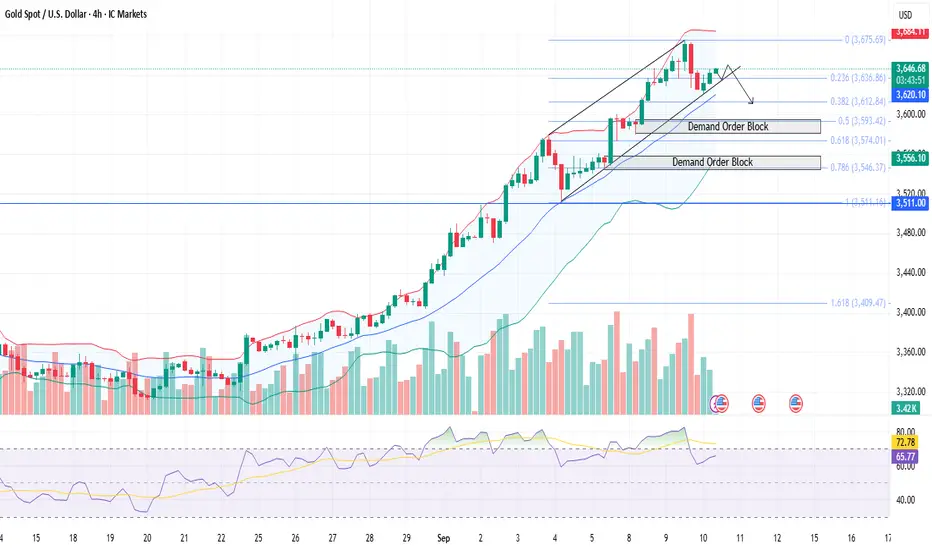
Gold recently tested record highs around $3675, but prices are showing corrections as traders must have started booking profits from the extreme high level.
On the 4H chart, the price action remains within an ascending channel, suggesting that the broader trend still carries mild bullish momentum.
After touching the lower trendline of the channel, gold is showing signs of stabilization, but upside momentum is weakening.
The immediate support lies between $3636 (Fib 0.236 level) and $3620 (middle Bollinger Band) — a breakdown below this zone could trigger further correction toward $3612–$3593 (Fib 0.382–0.5 levels).
On the upside, if gold holds above the channel support, recovery toward $3675 highs cannot be ruled out, though momentum indicators suggest caution.
Overall: Gold is still in a short-term bullish structure but vulnerable to deeper pullbacks if the key $3636–3620 zone breaks.
On the 4H chart, the price action remains within an ascending channel, suggesting that the broader trend still carries mild bullish momentum.
After touching the lower trendline of the channel, gold is showing signs of stabilization, but upside momentum is weakening.
The immediate support lies between $3636 (Fib 0.236 level) and $3620 (middle Bollinger Band) — a breakdown below this zone could trigger further correction toward $3612–$3593 (Fib 0.382–0.5 levels).
On the upside, if gold holds above the channel support, recovery toward $3675 highs cannot be ruled out, though momentum indicators suggest caution.
Overall: Gold is still in a short-term bullish structure but vulnerable to deeper pullbacks if the key $3636–3620 zone breaks.

免責聲明
這些資訊和出版物並非旨在提供,也不構成TradingView提供或認可的任何形式的財務、投資、交易或其他類型的建議或推薦。請閱讀使用條款以了解更多資訊。
免責聲明
這些資訊和出版物並非旨在提供,也不構成TradingView提供或認可的任何形式的財務、投資、交易或其他類型的建議或推薦。請閱讀使用條款以了解更多資訊。