
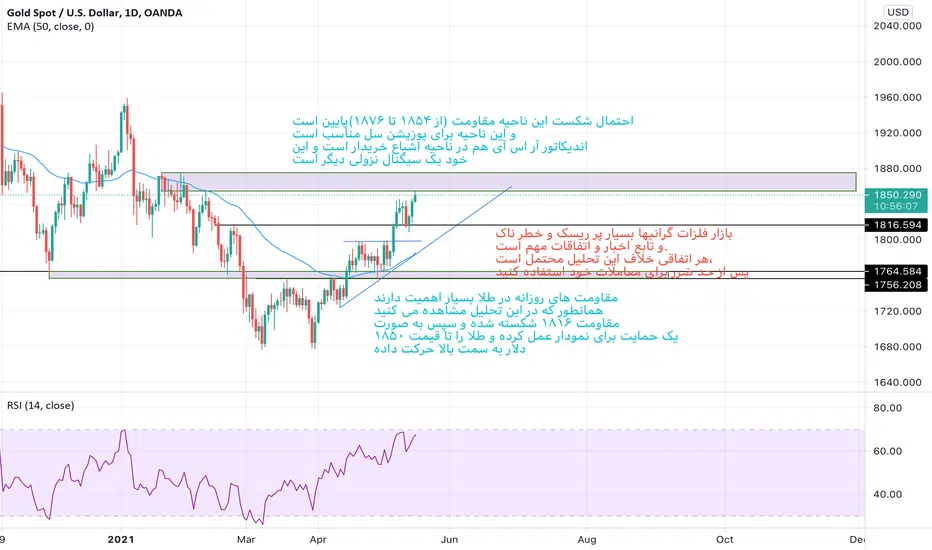
Daily resistances are really crucial for charts. We do not speculate that the chart can surpass the resistance zone(1854-1876).Meanwhile the RSI indicator is in “over-sold” area which is another bearish signal for the chart.

免責聲明
這些資訊和出版物並非旨在提供,也不構成TradingView提供或認可的任何形式的財務、投資、交易或其他類型的建議或推薦。請閱讀使用條款以了解更多資訊。
免責聲明
這些資訊和出版物並非旨在提供,也不構成TradingView提供或認可的任何形式的財務、投資、交易或其他類型的建議或推薦。請閱讀使用條款以了解更多資訊。