
Like Explained in the previous Idea about GOLD
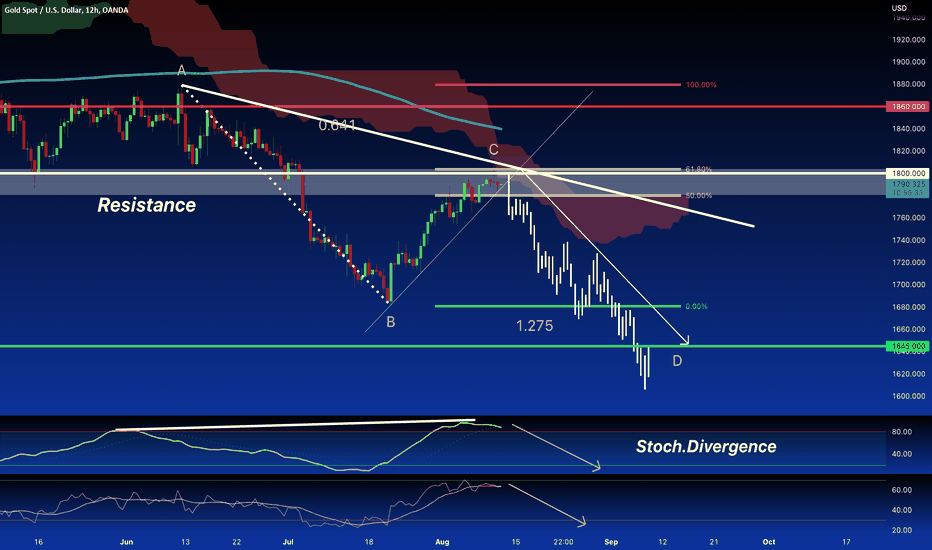
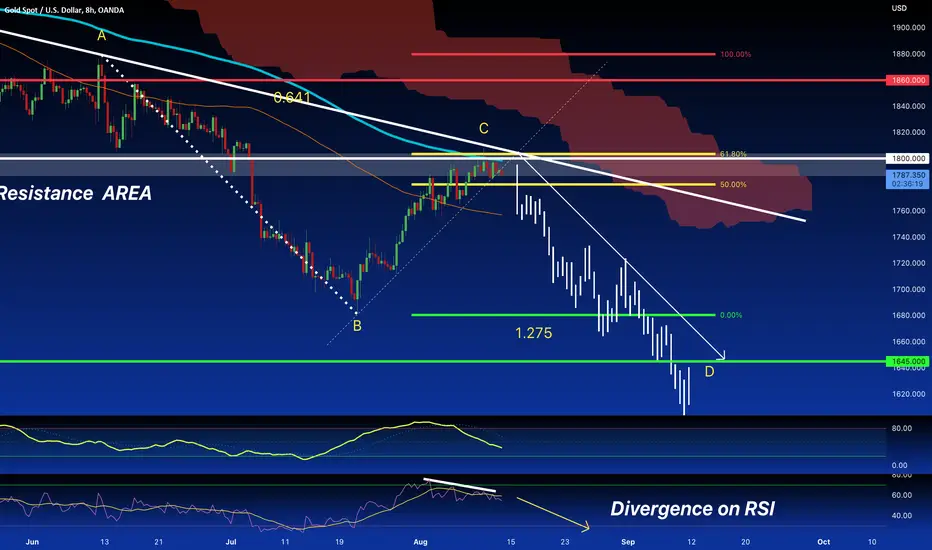
Today we Analyze the GOLD chart from the 8H timeframe for a better zoom of the situation. The price after a Deep Pullback, touched and reject the 61.8% Fibo area of resistance ( White rectangle ) around 1800.00 and, as we can see the price seems ready to revert its bullish momentum in favor of the Main trend, the Bearish one.The price also feel the 200 SMA in this timeframe like a dynamic resistance to not go over. The RSI is still in overbought with divergences, Ichimoku also in this timeframe gives a Bearish forecast and our clues continue to be for a Bearish setup.
Today we Analyze the GOLD chart from the 8H timeframe for a better zoom of the situation. The price after a Deep Pullback, touched and reject the 61.8% Fibo area of resistance ( White rectangle ) around 1800.00 and, as we can see the price seems ready to revert its bullish momentum in favor of the Main trend, the Bearish one.The price also feel the 200 SMA in this timeframe like a dynamic resistance to not go over. The RSI is still in overbought with divergences, Ichimoku also in this timeframe gives a Bearish forecast and our clues continue to be for a Bearish setup.
註釋
NEW UPDATE 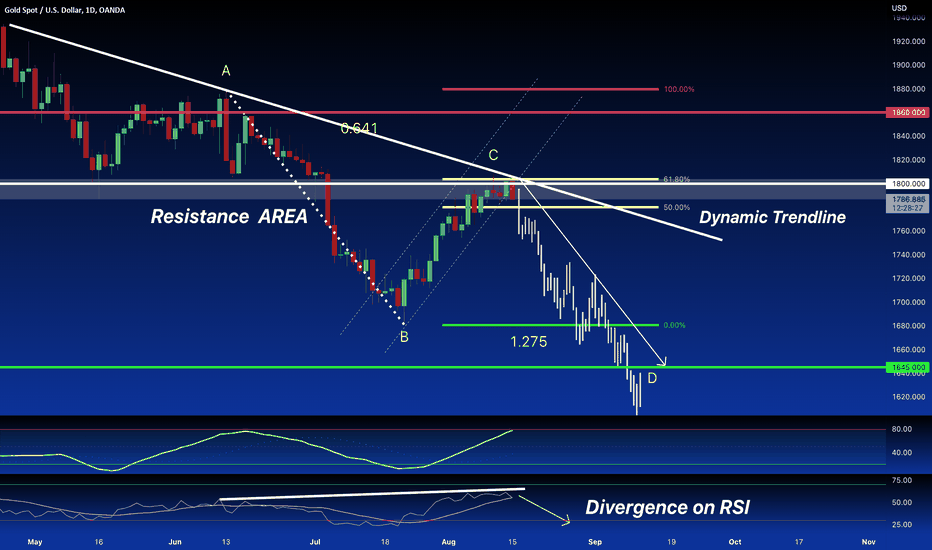

相關出版品
免責聲明
這些資訊和出版物並非旨在提供,也不構成TradingView提供或認可的任何形式的財務、投資、交易或其他類型的建議或推薦。請閱讀使用條款以了解更多資訊。