
Hi there
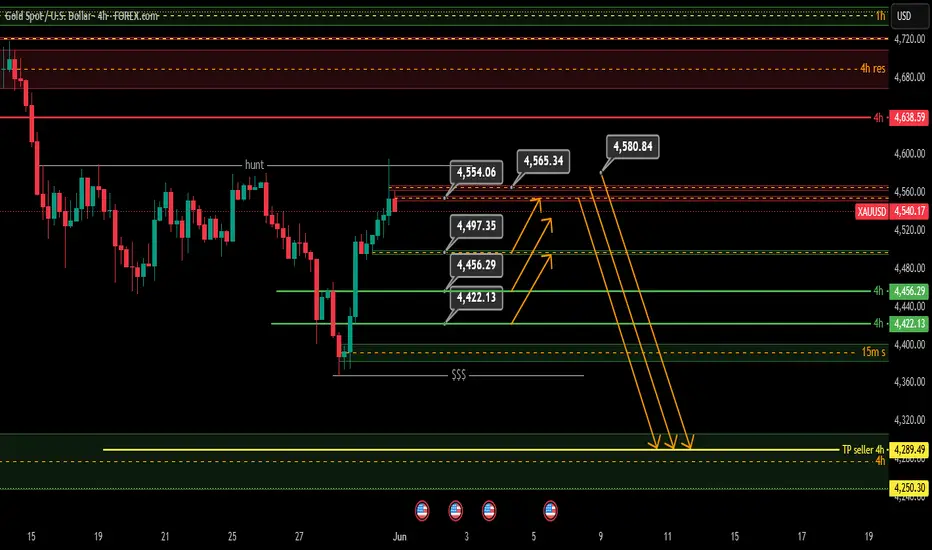
The 4-hour time frame gold chart structure has maintained its downward phase for the time being and we had liquidity accumulation last week.
Considering the liquidity left at the last bottom, it can be considered that the goal of the upward lag is to accumulate liquidity (market fuel) to move towards the liquidity of this bottom. Considering this perspective, the important support points on the 4-hour chart are characterized by looking for a buy (pullback) at these three points in the lower time frame and if you see three important resistances, look for a trigger sell in the direction of the current market structure.
Similarly, the 4-hour algorithm is the seller's hand and the TP of this algorithm is defined as 4289.
Good luck.
The 4-hour time frame gold chart structure has maintained its downward phase for the time being and we had liquidity accumulation last week.
Considering the liquidity left at the last bottom, it can be considered that the goal of the upward lag is to accumulate liquidity (market fuel) to move towards the liquidity of this bottom. Considering this perspective, the important support points on the 4-hour chart are characterized by looking for a buy (pullback) at these three points in the lower time frame and if you see three important resistances, look for a trigger sell in the direction of the current market structure.
Similarly, the 4-hour algorithm is the seller's hand and the TP of this algorithm is defined as 4289.
Good luck.
交易進行
Gold 4-hour time frame chart update. Almost all targets from up to down were seen.
免責聲明
這些資訊和出版物並非旨在提供,也不構成TradingView提供或認可的任何形式的財務、投資、交易或其他類型的建議或推薦。請閱讀使用條款以了解更多資訊。
免責聲明
這些資訊和出版物並非旨在提供,也不構成TradingView提供或認可的任何形式的財務、投資、交易或其他類型的建議或推薦。請閱讀使用條款以了解更多資訊。