
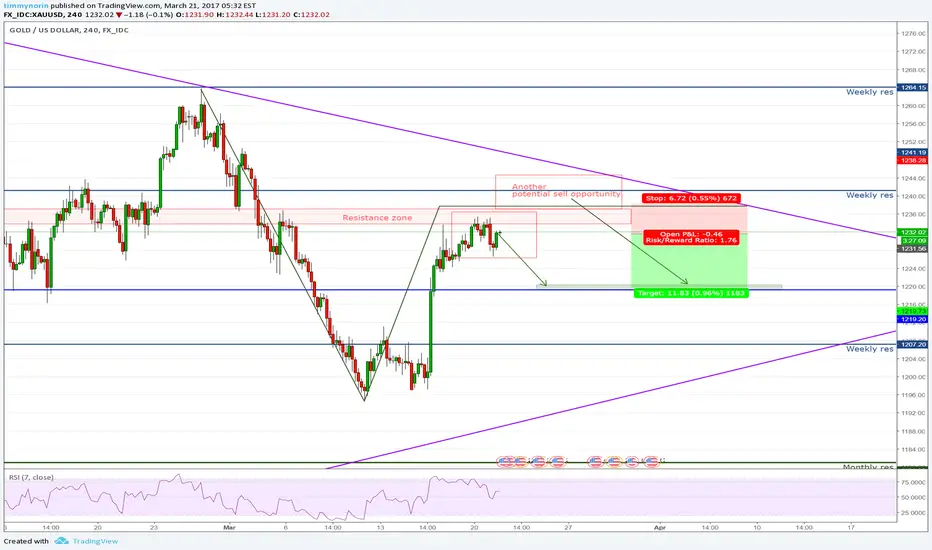
Looking at the 4 hour chart we have found resistance at historically strong support and resistance zone. Price did not manage to close above 1234.00 despite several attempts. Right above us we find a 0.618 fibonacci retracement.
Looking down at the hourly we also see a 2618, a double top (which also can be seen on 4h) followed by a 0.618 retracement after breaking to the downside, passing the "V" point of the double top.
I take this as a first, of two, possible entries to sell. Target 1220.00
Lets see how we do
Looking down at the hourly we also see a 2618, a double top (which also can be seen on 4h) followed by a 0.618 retracement after breaking to the downside, passing the "V" point of the double top.
I take this as a first, of two, possible entries to sell. Target 1220.00
Lets see how we do
交易結束:達到停損點
First entry, unsuccessful. I will monitor this since we are now in the second entry zone. If I get signals here, I will enter a new short position, published on a new chart.
免責聲明
這些資訊和出版物並非旨在提供,也不構成TradingView提供或認可的任何形式的財務、投資、交易或其他類型的建議或推薦。請閱讀使用條款以了解更多資訊。
免責聲明
這些資訊和出版物並非旨在提供,也不構成TradingView提供或認可的任何形式的財務、投資、交易或其他類型的建議或推薦。請閱讀使用條款以了解更多資訊。