
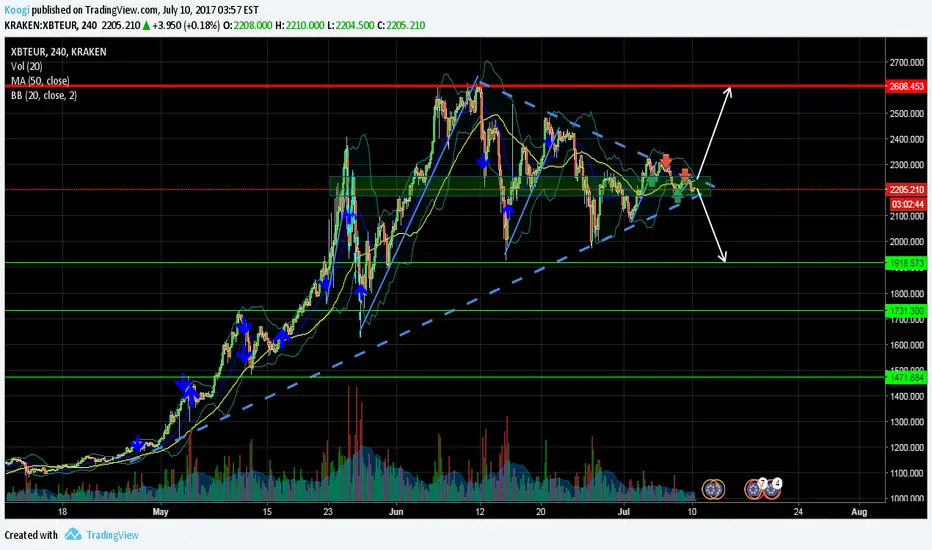
I have been trying to catch the break out for the last few days with a tight stop loss just in case it goes the other way which is also very possible. The pull back from all time highs hasn't been strong enough to suggest a reversal in trend so I believe this to be a continuation pattern. I will be waiting for break out confirmation before I get in again though.
The pattern is a symmetrical triangle so see the below link for more info.
stockcharts.com/school/doku.php?id=chart_school:chart_analysis:chart_patterns:symmetrical_triangle_continuation
The pattern is a symmetrical triangle so see the below link for more info.
stockcharts.com/school/doku.php?id=chart_school:chart_analysis:chart_patterns:symmetrical_triangle_continuation
註釋
Break out to the down side confirmed. :-(
免責聲明
這些資訊和出版物並非旨在提供,也不構成TradingView提供或認可的任何形式的財務、投資、交易或其他類型的建議或推薦。請閱讀使用條款以了解更多資訊。