做多
XEM Go Long: Triple Bottom Formation
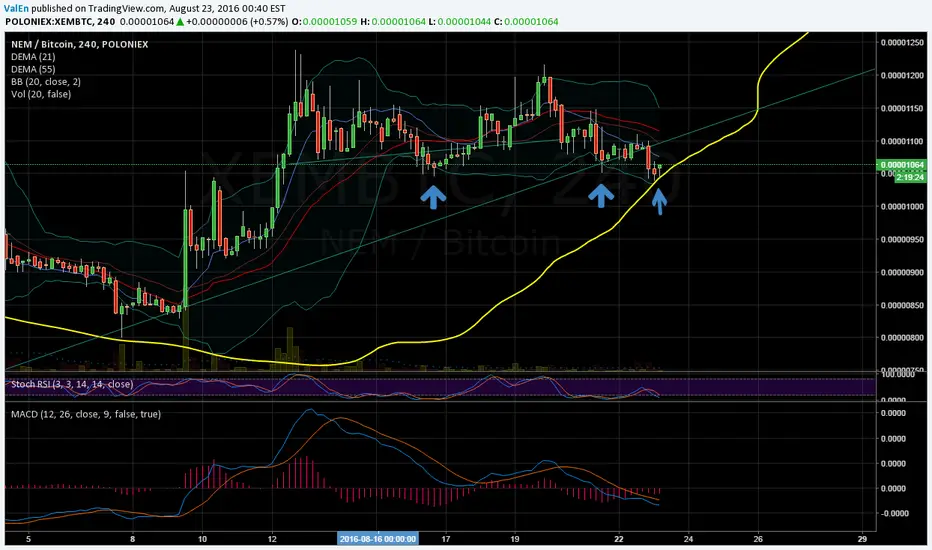
As the Triple Bottom Reversal develops, it can start to resemble a number of patterns. Before the third low forms, the pattern may look like a Double Bottom Reversal. Three equal lows can also be found in a descending triangle or rectangle. Of these patterns mentioned, only the descending triangle has bearish overtones; the others are neutral until a breakout occurs. Similarly, the Triple Bottom Reversal should also be treated as a neutral pattern until a breakout occurs. The ability to hold support is bullish, but demand has not won the battle until resistance is broken. Volume on the last advance can sometimes yield a clue. If there is a sharp increase in volume and momentum, then the chances of a breakout increase.
Source:stockcharts.com/school/doku.php?id=chart_school:chart_analysis:chart_patterns:triple_bottom_reversal
Source:stockcharts.com/school/doku.php?id=chart_school:chart_analysis:chart_patterns:triple_bottom_reversal

免責聲明
這些資訊和出版物並非旨在提供,也不構成TradingView提供或認可的任何形式的財務、投資、交易或其他類型的建議或推薦。請閱讀使用條款以了解更多資訊。