做空
NEM Downside Correction
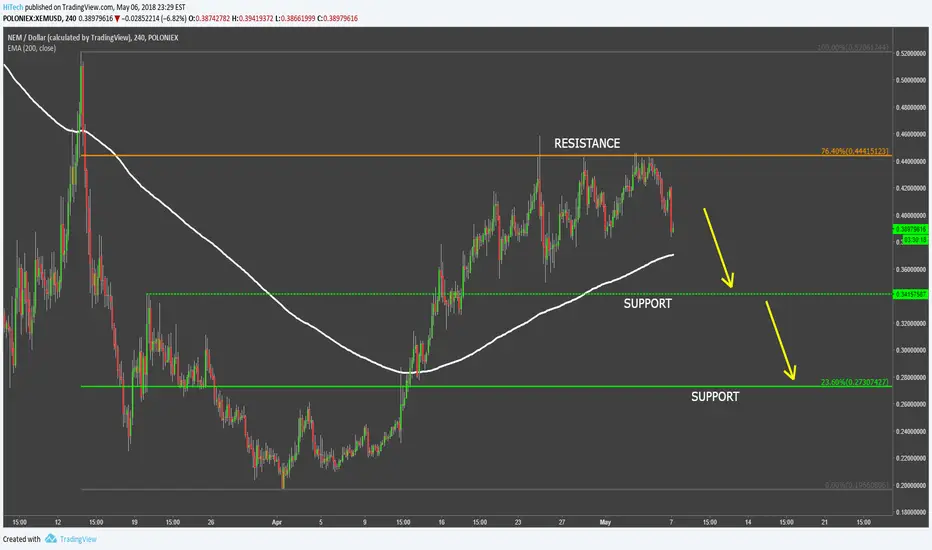
NEM has reached the high at $0.46 and then formed a strong resistance at the 76.4% Fibonacci retracement level, which is $0.44. The resistance has been rejected for tree consecutive times suggesting the corrective move down.
XEM/USD first downside target is seen at $0.34, where resistance was formed back on the 20th of March. Second support is based at 23.6% Fibs, that is $0.27 and this is the area where the 200 Moving Average was broken. It is important to watch these resistance levels for either a rejection of a breakout, but only break and close below the $0.27 could be a confirmation of a downtrend continuation.
On the upside, clearly the resistance at $0.44 in general and $0.46 level in particular must be broken, with the daily close above it. In that case the uptrend is likely to continue and could result in exponential growth.
XEM/USD first downside target is seen at $0.34, where resistance was formed back on the 20th of March. Second support is based at 23.6% Fibs, that is $0.27 and this is the area where the 200 Moving Average was broken. It is important to watch these resistance levels for either a rejection of a breakout, but only break and close below the $0.27 could be a confirmation of a downtrend continuation.
On the upside, clearly the resistance at $0.44 in general and $0.46 level in particular must be broken, with the daily close above it. In that case the uptrend is likely to continue and could result in exponential growth.
註釋
NEM hitting the support... is it a reversal?交易結束:目標達成
交易結束:目標達成

免責聲明
這些資訊和出版物並非旨在提供,也不構成TradingView提供或認可的任何形式的財務、投資、交易或其他類型的建議或推薦。請閱讀使用條款以了解更多資訊。
免責聲明
這些資訊和出版物並非旨在提供,也不構成TradingView提供或認可的任何形式的財務、投資、交易或其他類型的建議或推薦。請閱讀使用條款以了解更多資訊。