
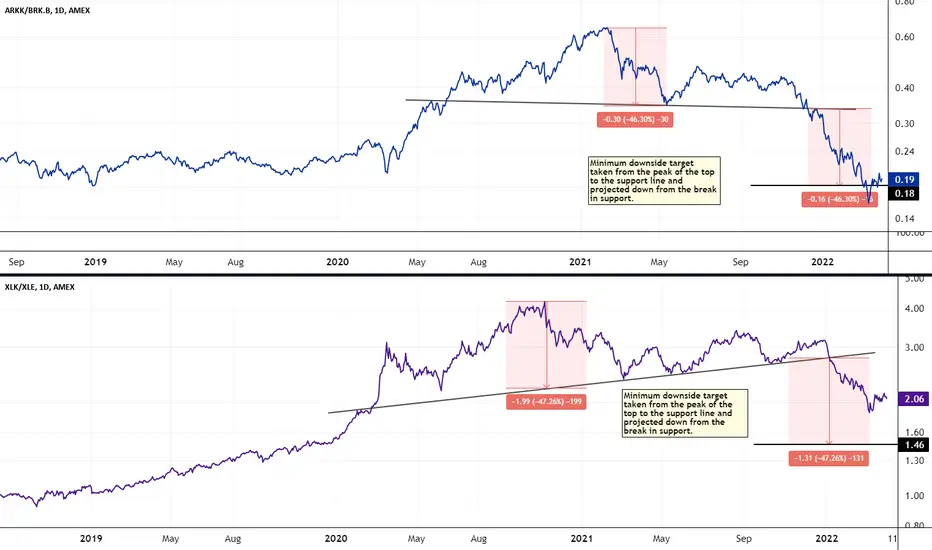
While these two charts aren't the same, they are very similar. The top chart is a ratio chart of ARKK vs Berk.B. The bottom chart is a ratio chart of Tech vs Energy. If the top chart is any indication of the overall trend, then there's plenty of upside in energy still. The downside of ARKK vs BERK.B overshot the minimum downside target. This is a logical area for a bounce. The Tech vs Energy ratio looks to have a ways to go still. These rounded tops are very dependable reversal patterns. Keep your eye open for broken support lines when watching these rounded tops play out.

相關出版品
免責聲明
這些資訊和出版物並非旨在提供,也不構成TradingView提供或認可的任何形式的財務、投資、交易或其他類型的建議或推薦。請閱讀使用條款以了解更多資訊。