
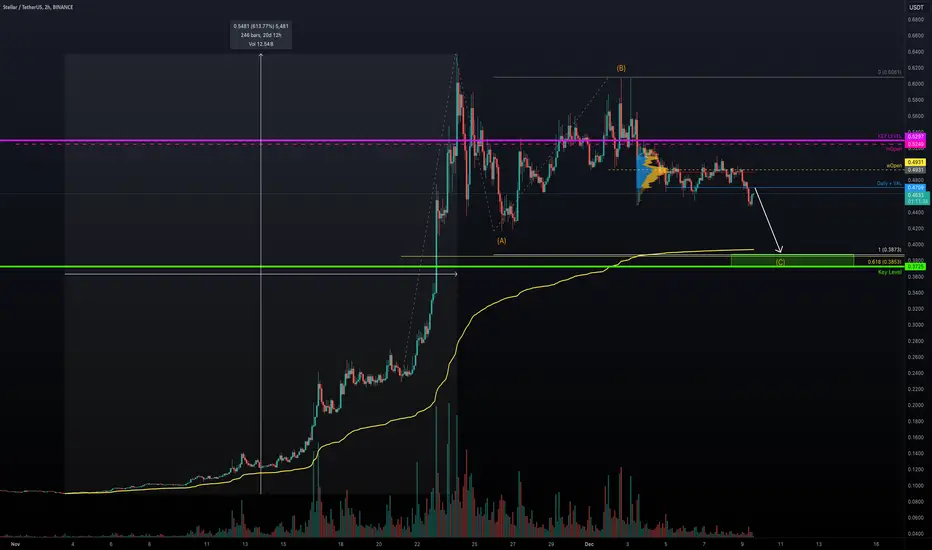
XLM had an increase of over +600% in just 20 days followed by a 15-day consolidation phase suggests an exhaustion of the previous trend. The sideways movement aligns with an ABC correction, where wave C is likely unfolding.
Key Levels and Confluence
Trend-Based Fibonacci Extensions:
1:1 Target for Wave C: $0.3873
Key Support Zone:
$0.3725−$0.3873
Market Sentiment
Lack of Volume: Reflects reduced interest from buyers, confirming a bearish bias.
Below Weekly and Monthly Opens: These levels often act as dynamic resistance, showing bears are in control for now.

🏆 Mastering Fibonacci for precision trading
🔹 Sharing high-probability trade setups
⚡ Unlock the power of technical analysis!
🔹 Sharing high-probability trade setups
⚡ Unlock the power of technical analysis!
免責聲明
這些資訊和出版物並非旨在提供,也不構成TradingView提供或認可的任何形式的財務、投資、交易或其他類型的建議或推薦。請閱讀使用條款以了解更多資訊。
🏆 Mastering Fibonacci for precision trading
🔹 Sharing high-probability trade setups
⚡ Unlock the power of technical analysis!
🔹 Sharing high-probability trade setups
⚡ Unlock the power of technical analysis!
免責聲明
這些資訊和出版物並非旨在提供,也不構成TradingView提供或認可的任何形式的財務、投資、交易或其他類型的建議或推薦。請閱讀使用條款以了解更多資訊。