搜尋
產品
社群
市場
經紀商
更多
TW
立即開始
Persistence / Tether
做多
2021年10月26日
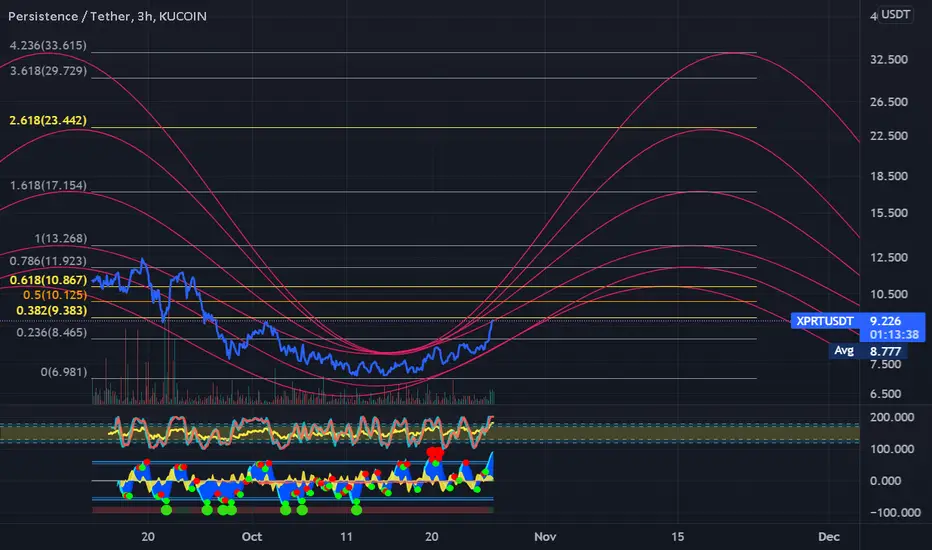
XPRT Sine Chart
0
取得這個圖表
290
A example of using parabolas and sine waves to identify time based support/resistance channels and fibs.
SpuntRader
關注
正在關注
Trend Analysis
xprt
XPRTUSDT
免責聲明
這些資訊和出版物並非旨在提供,也不構成TradingView提供或認可的任何形式的財務、投資、交易或其他類型的建議或推薦。請閱讀
使用條款
以了解更多資訊。
Trend Analysis
xprt
XPRTUSDT
SpuntRader
關注
正在關注
免責聲明
這些資訊和出版物並非旨在提供,也不構成TradingView提供或認可的任何形式的財務、投資、交易或其他類型的建議或推薦。請閱讀
使用條款
以了解更多資訊。