
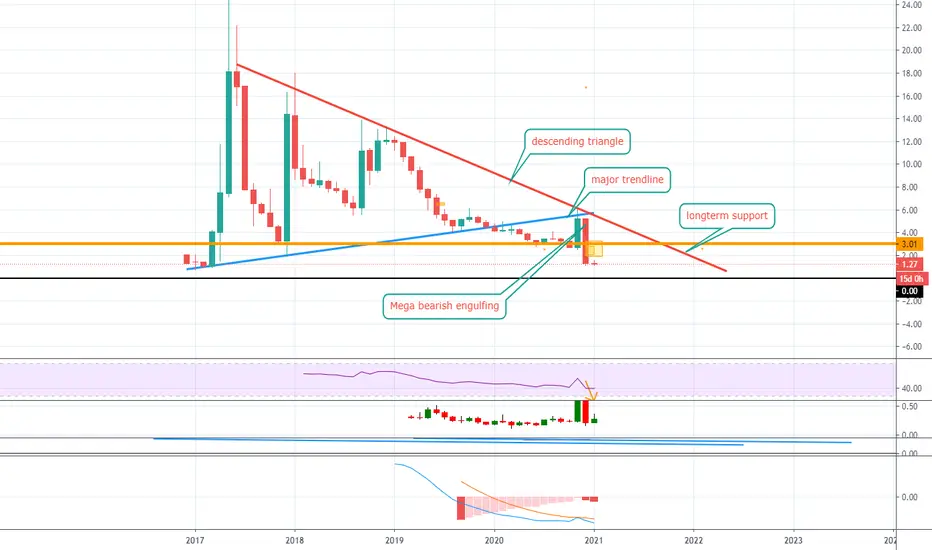
Never saw a more bearish chart and this is the monthly. Here goes:
-Dom rejected from descending triangle resistance.
-Dom fell under long-term rising trendline
-Dom monthly closed way below major longterm horizontal support.
-Mega bearish engulfing monthly candle, almost 70% larger than the bullish candle.
-MACD has been in the red forever.
How is bullish?
-Dom rejected from descending triangle resistance.
-Dom fell under long-term rising trendline
-Dom monthly closed way below major longterm horizontal support.
-Mega bearish engulfing monthly candle, almost 70% larger than the bullish candle.
-MACD has been in the red forever.
How is bullish?

相關出版品
免責聲明
這些資訊和出版物並非旨在提供,也不構成TradingView提供或認可的任何形式的財務、投資、交易或其他類型的建議或推薦。請閱讀使用條款以了解更多資訊。