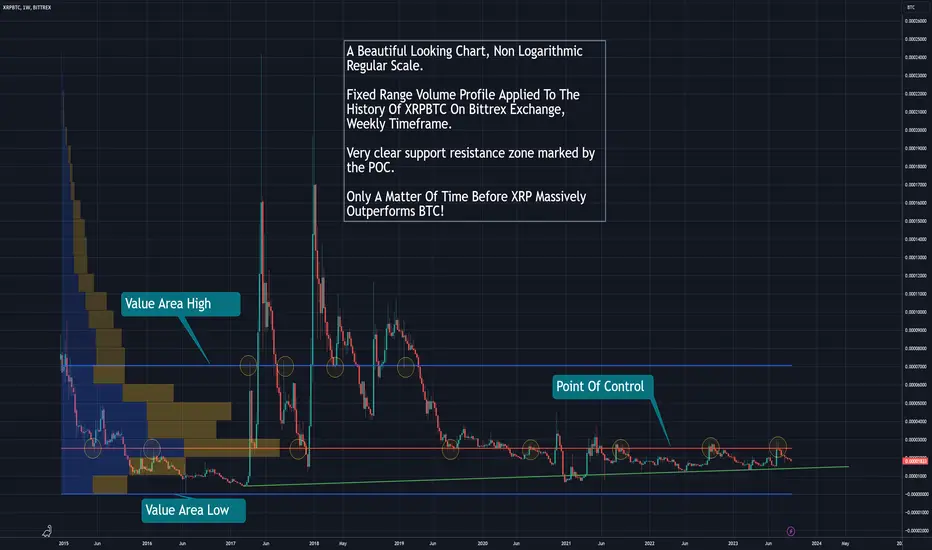
I applied the fixed range volume profile tool to the history of XRPBTC pair on Bittrex on a weekly timeframe. It shows a very well defined clear level of support and resistance formed by the POC.
This has to be the most bullish chart out there. No doubt once XRPBTC breaks out of this zone, it will significantly outperform BTC.
This is a regular scale / nonlogarithmic chart, which I think gives you a better image of what XRP can do once it breaks out of this range.
This has to be the most bullish chart out there. No doubt once XRPBTC breaks out of this zone, it will significantly outperform BTC.
This is a regular scale / nonlogarithmic chart, which I think gives you a better image of what XRP can do once it breaks out of this range.

免責聲明
這些資訊和出版物並非旨在提供,也不構成TradingView提供或認可的任何形式的財務、投資、交易或其他類型的建議或推薦。請閱讀使用條款以了解更多資訊。