
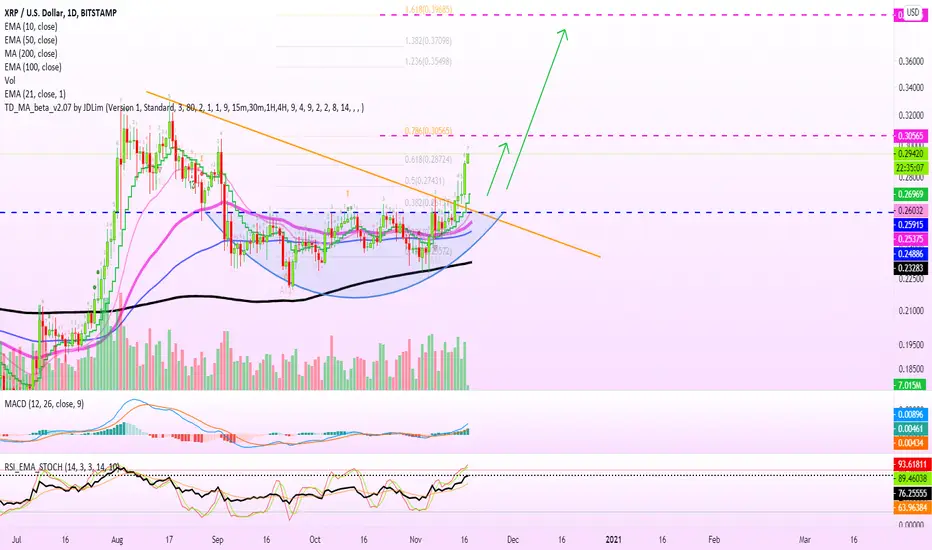
We hit this one perfect 14-Nov... There can be more.
(Previous chart)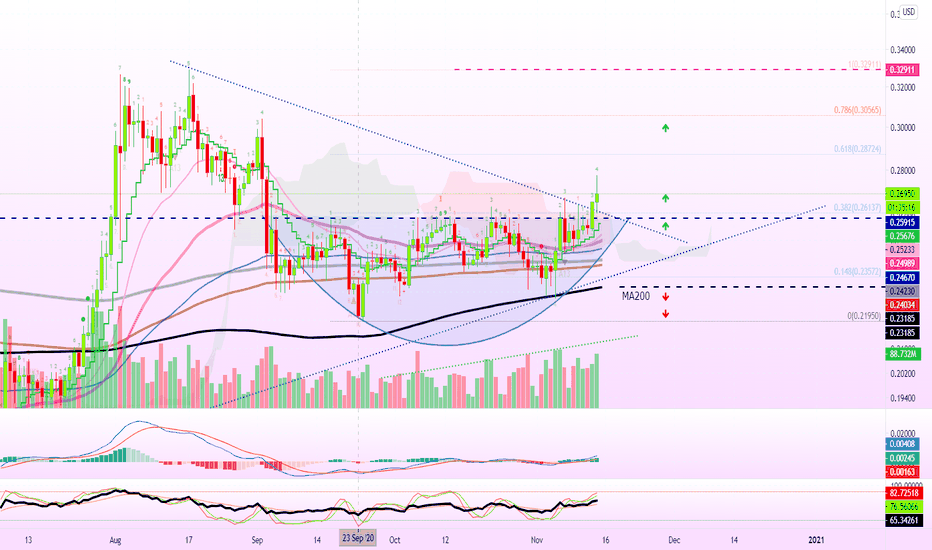
After the $0.32 target, we saw in my previous analysis, $0.3968 ($0.40) is what follows.
On this chart, we have a very strong RSI and a bullish MACD.
XRPUSD is only getting started and its price can continue to increase.
Thanks a lot for reading.
Namaste.
(Previous chart)
After the $0.32 target, we saw in my previous analysis, $0.3968 ($0.40) is what follows.
On this chart, we have a very strong RSI and a bullish MACD.
XRPUSD is only getting started and its price can continue to increase.
Thanks a lot for reading.
Namaste.
註釋
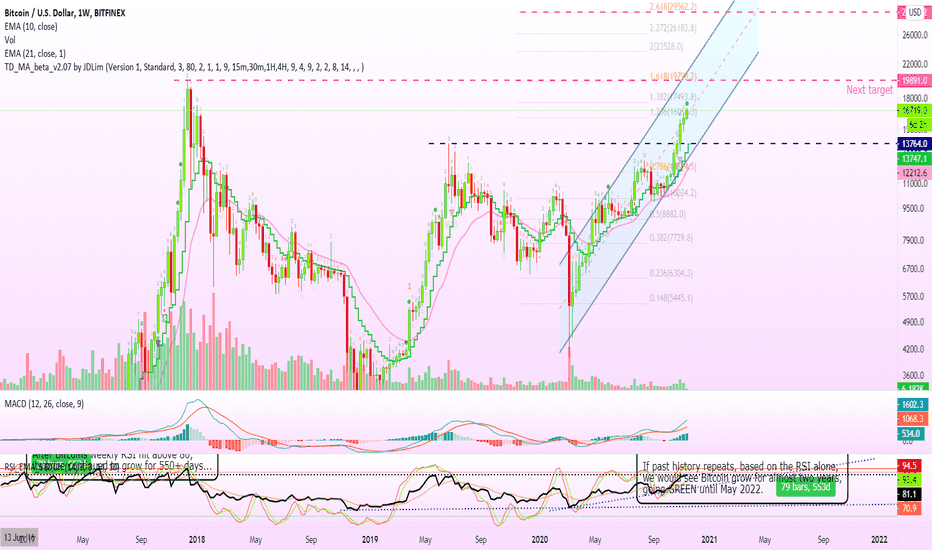
My fellow readers, please support my Bitcoin (BTCUSD) article below with your likes and comments... I will share as many Ripple updates as you wish...Thanks in advance.
🅱️ Bitcoin Weekly RSI Signals Growth Until May 2022 | 20,000 Next?!

🔥 Get the FULL (4-in-1) PREMIUM PACKAGE 👇
t.me/lamatrades/4 (Since 2017)
✅ FREE PREMIUM trade-numbers (4-10X) 👇
t.me/masteranandatrades/9043
🚨 TOP Results May 2026 👇
t.me/masteranandatrades/8778
t.me/lamatrades/4 (Since 2017)
✅ FREE PREMIUM trade-numbers (4-10X) 👇
t.me/masteranandatrades/9043
🚨 TOP Results May 2026 👇
t.me/masteranandatrades/8778
相關出版品
免責聲明
這些資訊和出版物並非旨在提供,也不構成TradingView提供或認可的任何形式的財務、投資、交易或其他類型的建議或推薦。請閱讀使用條款以了解更多資訊。
🔥 Get the FULL (4-in-1) PREMIUM PACKAGE 👇
t.me/lamatrades/4 (Since 2017)
✅ FREE PREMIUM trade-numbers (4-10X) 👇
t.me/masteranandatrades/9043
🚨 TOP Results May 2026 👇
t.me/masteranandatrades/8778
t.me/lamatrades/4 (Since 2017)
✅ FREE PREMIUM trade-numbers (4-10X) 👇
t.me/masteranandatrades/9043
🚨 TOP Results May 2026 👇
t.me/masteranandatrades/8778
相關出版品
免責聲明
這些資訊和出版物並非旨在提供,也不構成TradingView提供或認可的任何形式的財務、投資、交易或其他類型的建議或推薦。請閱讀使用條款以了解更多資訊。