
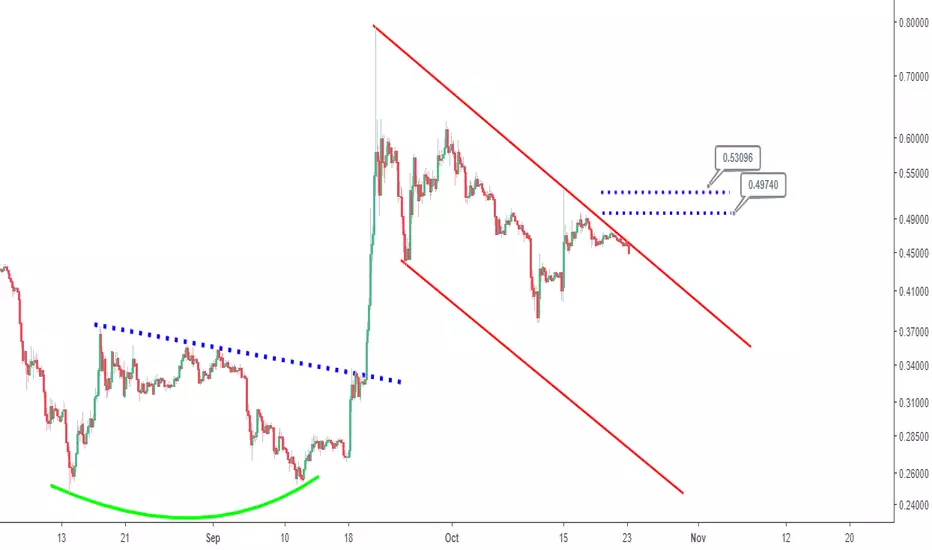
August 14, 2018 to September 20, 2018 marked the formation of a confirmed double bottom chart pattern in Ripple (XRP). Price action after confirmation reached a high of ~$0.79 before the current retracement that is captured with a bearish channel considered to be tentative.
Price action breaking to the upside of the bear channel and also above resistance as indicated by the horizontal blue lines does argue for a bullish bias for Ripple (XRP).
Price action breaking to the upside of the bear channel and also above resistance as indicated by the horizontal blue lines does argue for a bullish bias for Ripple (XRP).

相關出版品
免責聲明
這些資訊和出版物並非旨在提供,也不構成TradingView提供或認可的任何形式的財務、投資、交易或其他類型的建議或推薦。請閱讀使用條款以了解更多資訊。