
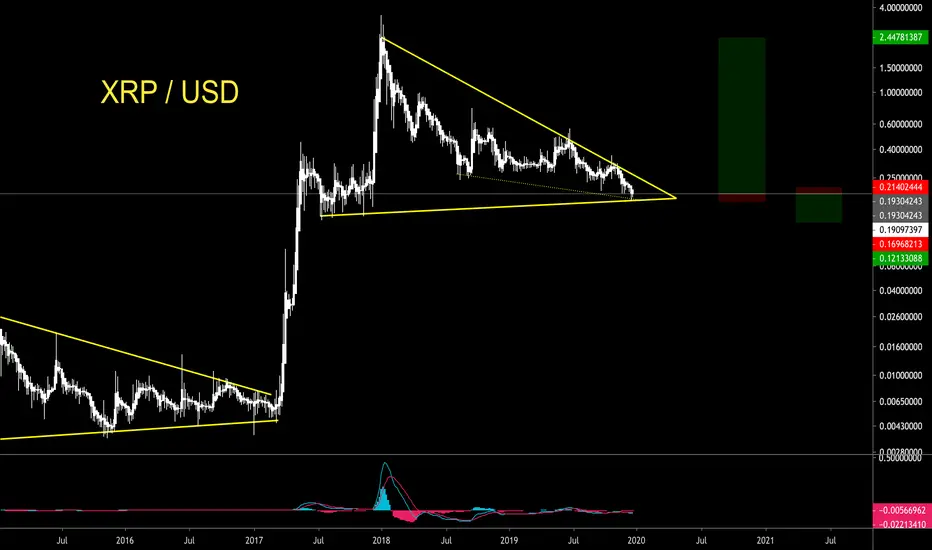
XRP / USD TA
Here we are looking at Symmetrical Triangle Chart Pattern which are usually bullish when seen in a general upward trend which is what we hav here. Usually you can expect a measured move towards the upside in a 2 wave sequence.
Bearish outlook is also in if we break through this pattern and support we will most likely drop towards 12 - 14 cent ranges.
Holders should not sell while traders should hedge their positions around here.
Here we are looking at Symmetrical Triangle Chart Pattern which are usually bullish when seen in a general upward trend which is what we hav here. Usually you can expect a measured move towards the upside in a 2 wave sequence.
Bearish outlook is also in if we break through this pattern and support we will most likely drop towards 12 - 14 cent ranges.
Holders should not sell while traders should hedge their positions around here.

相關出版品
免責聲明
這些資訊和出版物並非旨在提供,也不構成TradingView提供或認可的任何形式的財務、投資、交易或其他類型的建議或推薦。請閱讀使用條款以了解更多資訊。