
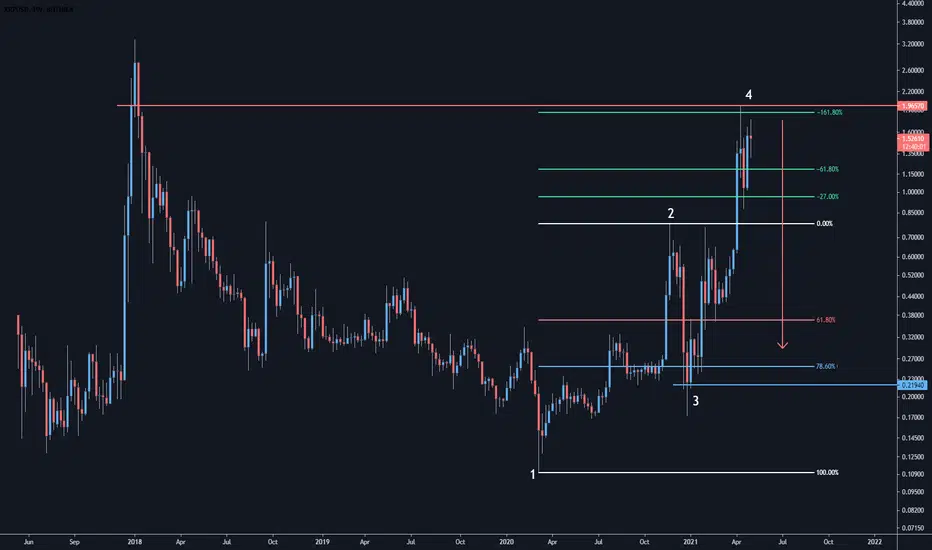
Following the previous post of the Monthly Timeframe, this Weekly Fibonacci further validates why $1.96 is a rejection zone.
The -161.8% Extension aligns with the Dec 2017 / Jan 2018 candle closes where we have tapped it perfectly.
I would anticipate that the next move would be back towards 61.8% and 78.6% retracements where we can identify the next set up.
I will post a Daily Timeframe analysis of this bias to complete the full top-down analysis which shows more confirmations.
The -161.8% Extension aligns with the Dec 2017 / Jan 2018 candle closes where we have tapped it perfectly.
I would anticipate that the next move would be back towards 61.8% and 78.6% retracements where we can identify the next set up.
I will post a Daily Timeframe analysis of this bias to complete the full top-down analysis which shows more confirmations.
註釋
Monthly Analysis - 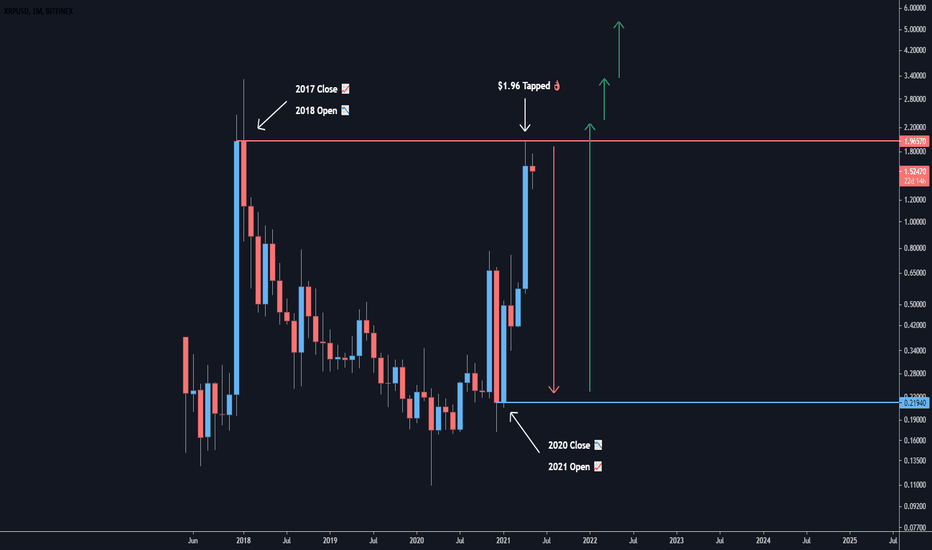
註釋
Daily Analysis - 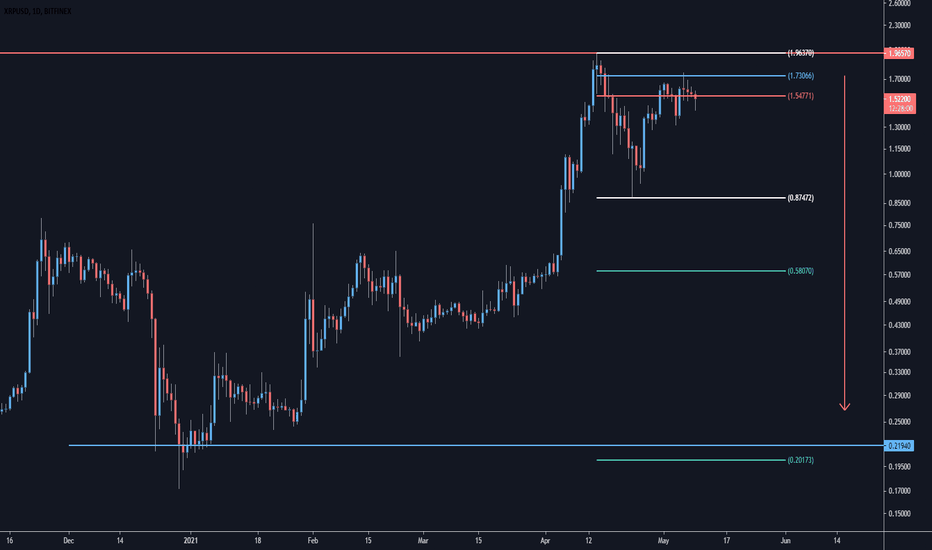

免責聲明
這些資訊和出版物並非旨在提供,也不構成TradingView提供或認可的任何形式的財務、投資、交易或其他類型的建議或推薦。請閱讀使用條款以了解更多資訊。