
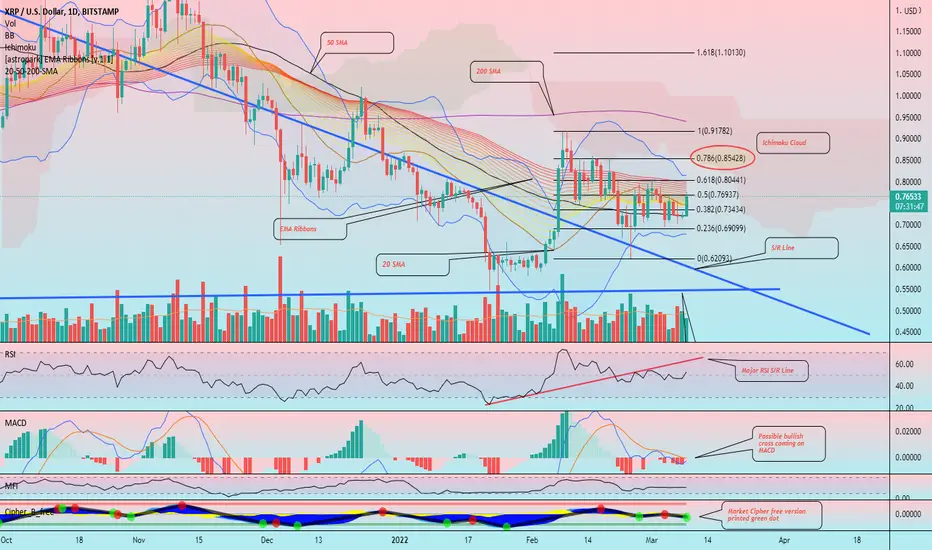
Hello friends, today you can review the technical analysis idea on a 1D linear scale chart for Ripple (XRP).
The chart is self-explanatory. Keep a close eye on the 0.786 Fibonacci Retracement level which is near the edge of the red Ichimoku Cloud. This may come in sync with the RSI getting to the Support and Resistance Line.
Shown in the chart: Trend line, Support and Resistance Trend Line, Relative Strength Index, MACD, Bollinger Bands, Money Flow Index, Fibonacci Retracement, EMA Ribbons, Simple Moving Average, Ichimoku Cloud, and Volume.
If you enjoy my ideas, feel free to like it and drop in a comment. I love reading your comments below.
Disclosure: This is just my opinion and not any type of financial advice. I enjoy charting and discussing technical analysis . Don't trade based on my advice. Do your own research! #cryptopickk
The chart is self-explanatory. Keep a close eye on the 0.786 Fibonacci Retracement level which is near the edge of the red Ichimoku Cloud. This may come in sync with the RSI getting to the Support and Resistance Line.
Shown in the chart: Trend line, Support and Resistance Trend Line, Relative Strength Index, MACD, Bollinger Bands, Money Flow Index, Fibonacci Retracement, EMA Ribbons, Simple Moving Average, Ichimoku Cloud, and Volume.
If you enjoy my ideas, feel free to like it and drop in a comment. I love reading your comments below.
Disclosure: This is just my opinion and not any type of financial advice. I enjoy charting and discussing technical analysis . Don't trade based on my advice. Do your own research! #cryptopickk

免責聲明
這些資訊和出版物並非旨在提供,也不構成TradingView提供或認可的任何形式的財務、投資、交易或其他類型的建議或推薦。請閱讀使用條款以了解更多資訊。