
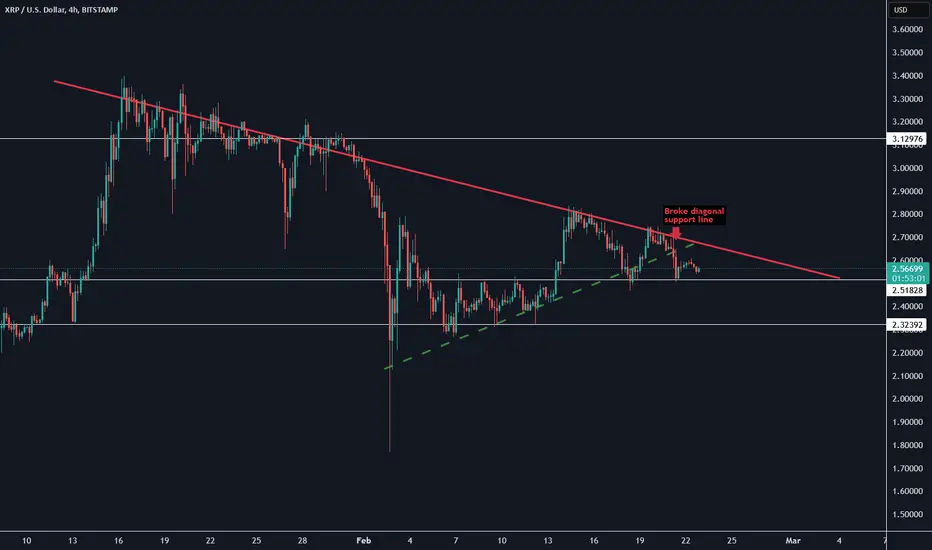
Although this is the most bullish we've seen XRP, it's notorious for parabolic pump and dumps.
It's been hitting it's head on this red trend line for over a month.
With a recent break above $2.52, it's now using that price point as support. But now forming a descending triangle.
I would wait for either the white support line or red resistance line to break before making any trades.
MACD on 1D is going from bullish to neutral/bearish.
-JumpStartCrypto
It's been hitting it's head on this red trend line for over a month.
With a recent break above $2.52, it's now using that price point as support. But now forming a descending triangle.
I would wait for either the white support line or red resistance line to break before making any trades.
MACD on 1D is going from bullish to neutral/bearish.
-JumpStartCrypto
註釋
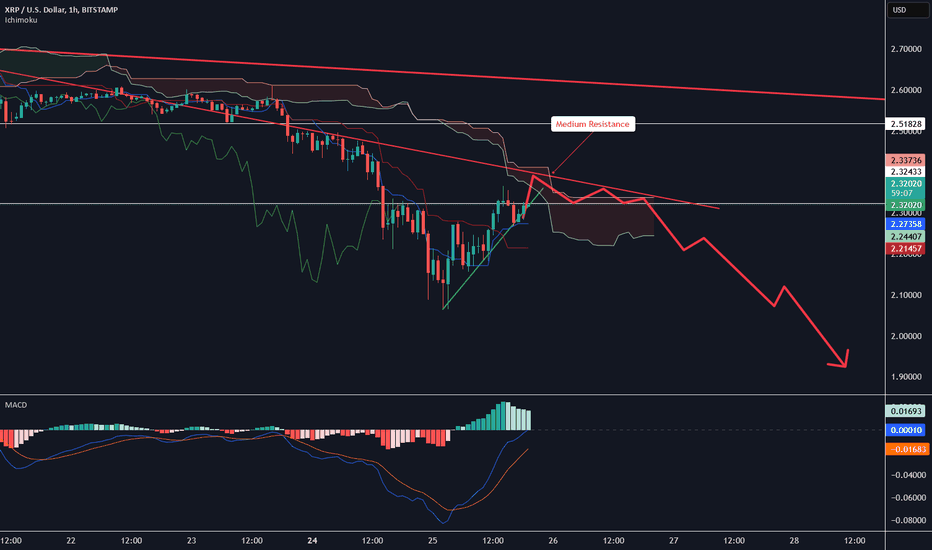
Zooming in now, $2.52 - $2.56 is medium resistance area now.註釋

🏆 Top Rated Crypto Trading Mentor on Fiverr
🎯 Years of TA Engineered into Automated Signals
💬 Contact me for FREE Mentorship + Signals
Telegram ▶ t.me/JumpStartCrypto
Discord ▶ JumpStartCrypto
🎯 Years of TA Engineered into Automated Signals
💬 Contact me for FREE Mentorship + Signals
Telegram ▶ t.me/JumpStartCrypto
Discord ▶ JumpStartCrypto
免責聲明
這些資訊和出版物並非旨在提供,也不構成TradingView提供或認可的任何形式的財務、投資、交易或其他類型的建議或推薦。請閱讀使用條款以了解更多資訊。
🏆 Top Rated Crypto Trading Mentor on Fiverr
🎯 Years of TA Engineered into Automated Signals
💬 Contact me for FREE Mentorship + Signals
Telegram ▶ t.me/JumpStartCrypto
Discord ▶ JumpStartCrypto
🎯 Years of TA Engineered into Automated Signals
💬 Contact me for FREE Mentorship + Signals
Telegram ▶ t.me/JumpStartCrypto
Discord ▶ JumpStartCrypto
免責聲明
這些資訊和出版物並非旨在提供,也不構成TradingView提供或認可的任何形式的財務、投資、交易或其他類型的建議或推薦。請閱讀使用條款以了解更多資訊。