做多
VERGE Double Bottom ?
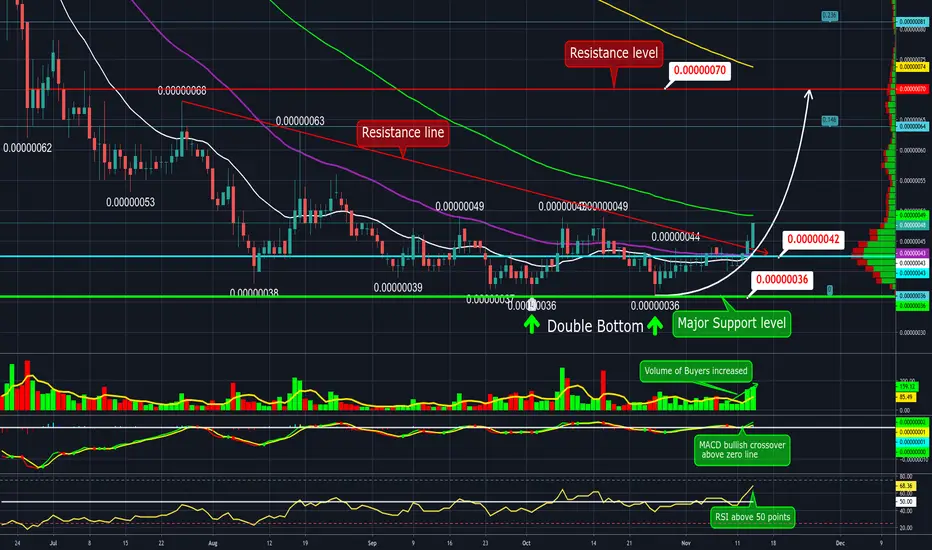
Verge price action above red resistance line breakout. Hodl above EMA 21,50 on daily TF. Testing EMA 100 which acting like resistance. Potential target 70 sats Resistance level.
Volume: of buyers increased.
Indicators: MACD bullish crossover above zero line. RSI above 50 points. Bullish sign.
Pattern: double bottom pattern at 36 sats.
S/R: Major Support 36 sats, Support 40 sats. Resistance 50 sats, Major Resistance 70 sats.
Disclaimer: THIS IS NOT FINANCIAL ADVICE. All the information shared here is for learning and entertainment purposes only.
Volume: of buyers increased.
Indicators: MACD bullish crossover above zero line. RSI above 50 points. Bullish sign.
Pattern: double bottom pattern at 36 sats.
S/R: Major Support 36 sats, Support 40 sats. Resistance 50 sats, Major Resistance 70 sats.
Disclaimer: THIS IS NOT FINANCIAL ADVICE. All the information shared here is for learning and entertainment purposes only.

免責聲明
這些資訊和出版物並非旨在提供,也不構成TradingView提供或認可的任何形式的財務、投資、交易或其他類型的建議或推薦。請閱讀使用條款以了解更多資訊。
免責聲明
這些資訊和出版物並非旨在提供,也不構成TradingView提供或認可的任何形式的財務、投資、交易或其他類型的建議或推薦。請閱讀使用條款以了解更多資訊。