YFIBTC - Case for Bulls
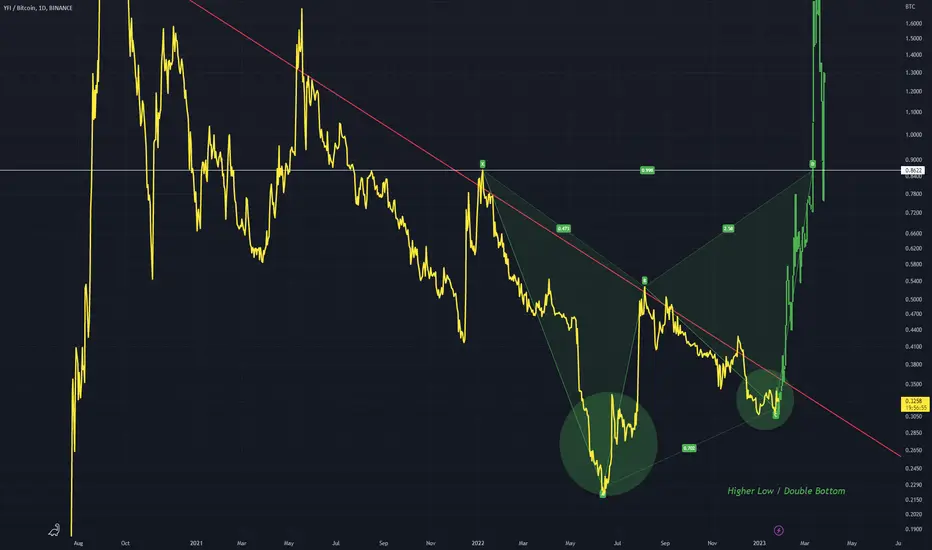
Currently this red trendline is dominant and should be considered when looking at this chart, as the dominant trend is down.
Ill give it a shot at picking the bottom though. A higher low and subsequent double bottom is a good candidate for a potential reversal
The ABCD pattern shows my thought process when looking at this chart structure
If price breaks down when the red line is hit then the bears are in control, but if it does breakout I expect it to move to D
Ill give it a shot at picking the bottom though. A higher low and subsequent double bottom is a good candidate for a potential reversal
The ABCD pattern shows my thought process when looking at this chart structure
If price breaks down when the red line is hit then the bears are in control, but if it does breakout I expect it to move to D

免責聲明
這些資訊和出版物並非旨在提供,也不構成TradingView提供或認可的任何形式的財務、投資、交易或其他類型的建議或推薦。請閱讀使用條款以了解更多資訊。