做多
YFIBTC - Possible Bullish Pattern
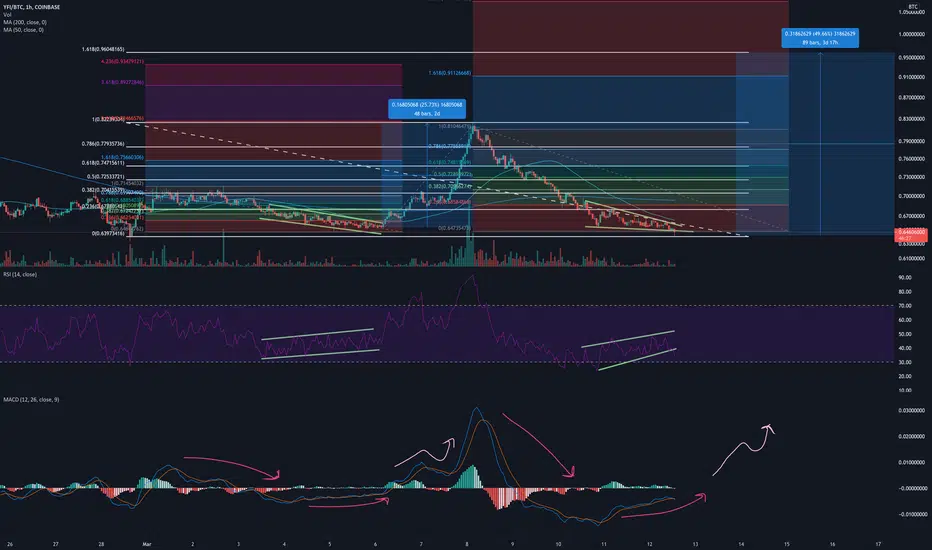
The YFI/BTC(Yearn.Finance) is forming a bullish RSI divergence like it did a few days ago before its ~25% increase which indicates a trend reversal.
For safer short term trading, wait until the 50MA & the 200MA make a golden cross on the 30minute/1hour chart.
If YFI breaks below the bottom fib level, I will expect further downward movement. I will be watching the fib levels for support and resistance if YFI begins to trend upwards.
For safer short term trading, wait until the 50MA & the 200MA make a golden cross on the 30minute/1hour chart.
If YFI breaks below the bottom fib level, I will expect further downward movement. I will be watching the fib levels for support and resistance if YFI begins to trend upwards.
註釋
YFI has dropped roughly 6% breaking below the bottom fib level.If YFI drops below .582 btc which is the bottom fib level on the 12H chart drawn from the low in beginning of January, I will expect even more downside

免責聲明
這些資訊和出版物並非旨在提供,也不構成TradingView提供或認可的任何形式的財務、投資、交易或其他類型的建議或推薦。請閱讀使用條款以了解更多資訊。