做多
YFII accumulation
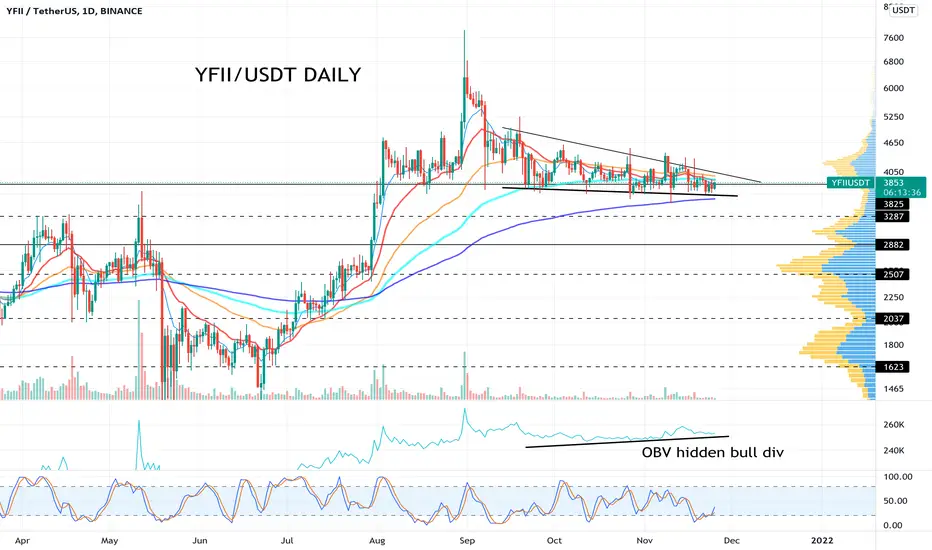
YFII daily chart shows a small hidden bull div with OBV.
This means that there has been accumulation even when price has trended down/sideways.
this wedge will probably breakup and break pretty strong. wait for breakout and ape.
This means that there has been accumulation even when price has trended down/sideways.
this wedge will probably breakup and break pretty strong. wait for breakout and ape.

免責聲明
這些資訊和出版物並非旨在提供,也不構成TradingView提供或認可的任何形式的財務、投資、交易或其他類型的建議或推薦。請閱讀使用條款以了解更多資訊。