
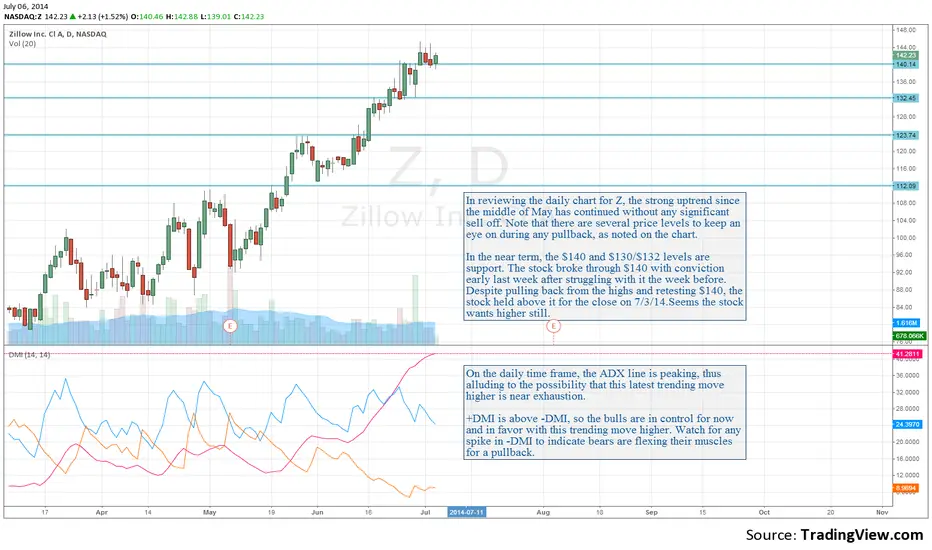
In reviewing the daily chart for Z, the strong uptrend since the middle of May has continued without any significant sell off. Note that there are several price levels to keep an eye on during any pullback, as noted on the chart.
In the near term, the $140 and $130/$132 levels are support. The stock broke through $140 with conviction early last week after struggling with it the week before. Despite pulling back from the highs and retesting $140, the stock held above it for the close on 7/3/14.Seems the stock wants higher still.
Blog post dated 07/05/2014: syncubate.com/blog/2014/7/6/zillow-trending-move-analysis
In the near term, the $140 and $130/$132 levels are support. The stock broke through $140 with conviction early last week after struggling with it the week before. Despite pulling back from the highs and retesting $140, the stock held above it for the close on 7/3/14.Seems the stock wants higher still.
Blog post dated 07/05/2014: syncubate.com/blog/2014/7/6/zillow-trending-move-analysis

免責聲明
這些資訊和出版物並非旨在提供,也不構成TradingView提供或認可的任何形式的財務、投資、交易或其他類型的建議或推薦。請閱讀使用條款以了解更多資訊。