已更新
ZClassic
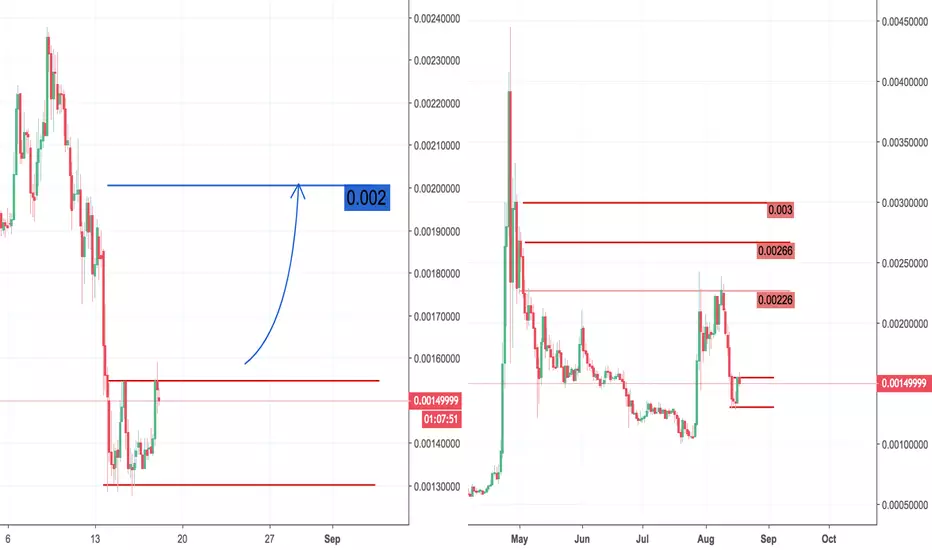
The left chart shows the trading range we are currently in. A break up would result in testing the 0.002 as a short term projection.
The right chart indicates more a long term projection. The resistance lines are shown.
Big news will follow up, until the fork happening on 10th of September.
The ANON Team will be announcing exchange markets , and some new surprises, which in my opinion will lead to the highs. Let's see :)
The right chart indicates more a long term projection. The resistance lines are shown.
Big news will follow up, until the fork happening on 10th of September.
The ANON Team will be announcing exchange markets , and some new surprises, which in my opinion will lead to the highs. Let's see :)
註釋

免責聲明
這些資訊和出版物並非旨在提供,也不構成TradingView提供或認可的任何形式的財務、投資、交易或其他類型的建議或推薦。請閱讀使用條款以了解更多資訊。