
Hello friends
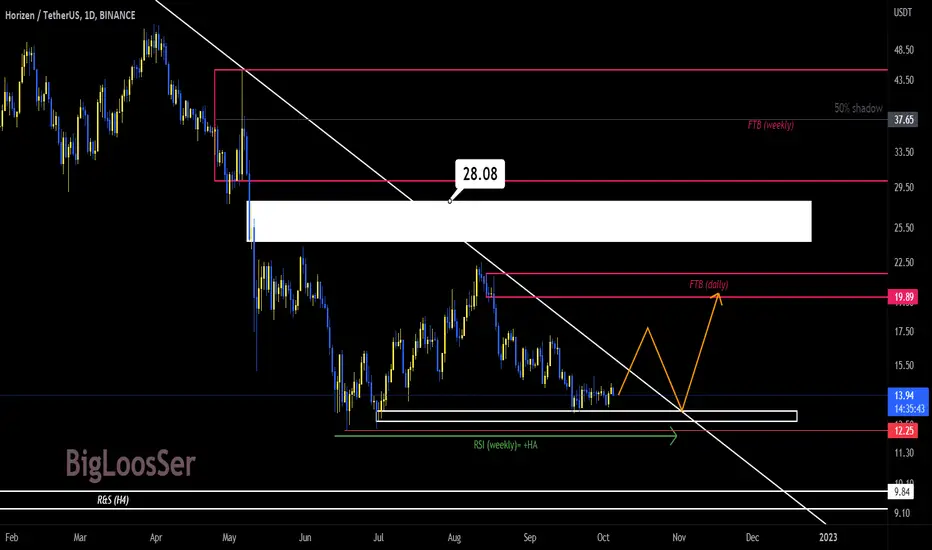
The positive divergence of the RSA in the weekly chart and the downward trend line , which the price is just below, is an interesting combination, isn't it!?
If the $12.25 range is maintained in the current trend and the upward trend is placed above the $17.2 price range, the long-term downward trend line will be broken upwards.
In this case, we can expect an increasing trend in the medium term.
What do you think?

免責聲明
這些資訊和出版物並非旨在提供,也不構成TradingView提供或認可的任何形式的財務、投資、交易或其他類型的建議或推薦。請閱讀使用條款以了解更多資訊。