
來自traddictiv的更多獨家指標
以每月$55.00的價格訂閱UFO Trading Suite — AutoClimate™ + AutoUFOs® (patented),即可取得該作者的獨家指標。您可直接在TradingView付款並立即於圖表上使用。
探索UFO Trading Suite — AutoClimate™ + AutoUFOs® (patented)Direction and location are different decisions
A breakout can tell us something important about direction without necessarily telling us where to enter.
That distinction matters because traders often treat the moment of a breakout as both a directional signal and an entry signal. Those are not the same thing. A market can produce strong evidence that a trend is continuing while simultaneously offering unattractive trade location.
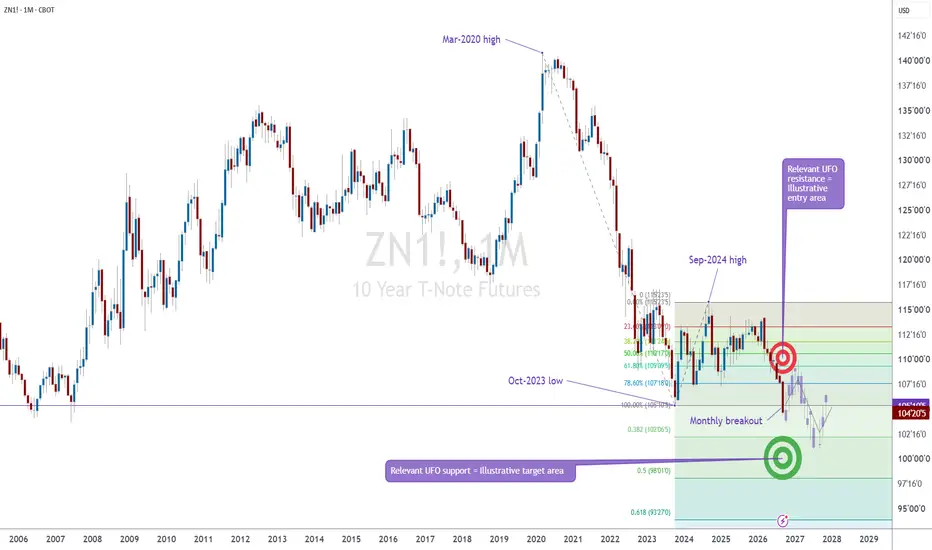
The monthly chart of 10-Year T-Note futures provides a useful case study. It shows a major high established in March 2020, followed by a prolonged decline into an important low in October 2023. The market then recovered into September 2024 before turning lower again.
More recently, price moved below the October 2023 low. On a monthly chart, breaking a level that had defined the bottom of a multi-year structure is more significant than breaking a short-term swing.
CME Group market commentary dated September 24, 2026 also reported 10-Year T-Note futures falling to new contract lows as the U.S. 10-year Treasury yield reached 5.15%, its highest level since 2007.
That evidence strengthens the bearish structural case. But it does not automatically make the current price an attractive place to establish a position.
The reusable lesson is simple:
A breakout can establish direction. A retracement can improve location.
Using extensions to identify the next decision area
One way to examine where a strong directional move could encounter a reaction is through Fibonacci extensions.
On the chart, the extension is constructed from the March 2020 high to the October 2023 low, with the projection beginning from the September 2024 rebound high.
The 38.2% extension appears around 102'06'5.
Very close to that projection is an independently identified UFO support area around 102'02'0.
That creates a potentially meaningful decision zone.
The importance is not that two analytical tools somehow guarantee a reversal. They do not. The value is that two different methods identify approximately the same area, giving us a location where observing the market's reaction may become particularly informative.
If the broader decline reaches this region, selling pressure could temporarily weaken and a rebound could develop.
But a reaction from support is not necessarily a reversal of the larger trend.
That distinction becomes the bridge between the breakout and a possible retracement setup.
A reaction can create the next setup
Suppose price reaches the 102 area and begins to recover.
A trader who remains focused on the larger bearish structure would not necessarily interpret that rebound as evidence that the downtrend has ended. Instead, the rebound could be treated as a retracement within the larger decline.
The Fibonacci retracement drawn from the October 2023 low to the September 2024 high helps map that possibility.
The 61.8% retracement sits near 109'09'5, while the nearby UFO resistance structure highlighted on the chart begins around 108'18'0. Rather than treating either price as an exact turning point, these levels can be viewed as a broader decision area.
That gives us a sequence:
Breakout first.
Potential reaction at projected support.
Retracement toward resistance.
Then reassessment of whether the original bearish structure remains intact.
This is very different from simply selling because price has broken support.
Why waiting can change the trade geometry
At the time of the chart capture, ZN was trading around 104'23'5.
Imagine establishing a short position immediately around that price while using an invalidation level near 113'00'0 and the 102'06'5 extension as the potential target.
The distance to the stop would be much larger than the remaining distance to the target. Direction might still be correct, but the trade geometry would be unattractive.
Now consider an alternative hypothetical scenario.
Suppose price first rebounds toward the upper part of the 108'18'0 to 109'09'5 resistance area, and an illustrative short entry is considered at 109'09'5.
Using 113'00'0 as an illustrative invalidation level and 102'06'5 as the potential target creates a very different structure.
The distance from 109'09'5 to 113'00'0 is approximately 3.70 points.
The distance from 109'09'5 to 102'06'5 is approximately 7.09 points.
That produces an illustrative reward-to-risk ratio of roughly 1.9 to 1 before transaction costs and possible slippage.
Nothing about the market's directional outlook has changed between the two examples.
Only the entry location has changed.
That is the core lesson.
Improving reward-to-risk does not have to mean forcing an unrealistically tight stop. It can instead mean waiting for price to come to a location where a logically placed invalidation level requires less risk relative to the potential target.
Of course, there is a trade-off: the retracement may never happen.
In that case, there is no setup under this framework.
Missing a move is different from accepting poor trade geometry simply because the market is moving.
Risk comes before conviction
It is tempting to think that stronger directional conviction justifies taking more risk.
A risk-first process reverses that logic.
The sequence becomes:
First define where the market thesis would no longer make sense.
Then calculate the distance between the potential entry and that invalidation point.
Then calculate the distance to a realistic target.
Only after those quantities are known can position size be considered.
In our illustrative scenario, a move from 109'09'5 to the 113'00'0 invalidation level represents approximately $3,703 of price risk per ZN contract before slippage and costs.
The potential move from 109'09'5 to 102'06'5 represents approximately $7,094 per contract.
Those dollar values become easier to understand once we decode the unusual way Treasury futures are quoted.
Why Treasury prices look unusual
Someone accustomed to stocks, currencies or many other futures markets may initially find a quote such as 102'06'5 confusing.
It should not be read as the ordinary decimal number 102.065.
10-Year T-Note futures follow the long-standing U.S. government bond-market convention of quoting fractional points in 32nds.
For ZN, one full price point is worth $1,000 per contract.
One thirty-second of a point is therefore worth:
$1,000 ÷ 32 = $31.25.
The minimum outright price movement in ZN is half of one thirty-second, or 1/64 of a point.
That tick is worth $15.625 per contract.
So 102'06'5 means:
102 points + 6.5/32 of a point.
Expressed as a conventional decimal price:
102 + 6.5 ÷ 32 = 102.203125.
The same logic applies to other levels on the chart.
102'02'0 equals 102.0625.
108'18'0 equals 108.5625.
109'09'5 equals 109.296875.
This fractional notation is not an oddity created by the futures contract. CME Treasury futures follow the quotation convention of the underlying U.S. government bond market.
Once that convention is understood, the price becomes straightforward to translate into dollar risk.
From fractions to position risk
Consider the illustrative entry at 109'09'5 and stop at 113'00'0.
The difference is 3.703125 price points.
Because one full point in ZN represents $1,000:
3.703125 × $1,000 = $3,703.125 per contract.
The same calculation can be expressed in ticks.
A ZN tick is 1/64 of a point.
The entry-to-stop distance is 237 ticks.
237 × $15.625 = $3,703.125.
The potential move from the entry to 102'06.5 is 454 ticks.
454 × $15.625 = $7,093.75.
The resulting ratio is approximately:
454 ÷ 237 = 1.92.
Understanding the quotation format therefore is not merely a matter of reading the chart correctly. It directly affects stop calculations, position sizing and the interpretation of monetary risk.
Margin is not the same as risk
ZN has a face value at maturity of $100,000 per contract.
At the time of writing, the CME maintenance performance-bond requirement associated with the outright contract was approximately $1,875.
Those amounts should not be confused with maximum trade risk.
Margin is collateral required to support the futures position. It does not define how much a position can lose.
Our illustrative stop distance alone represents about $3,703 per contract, already larger than the maintenance performance bond.
In addition, a stop order cannot guarantee execution at the exact stop price. Rapid market movement, overnight developments or gaps can create slippage, meaning realized losses may exceed the amount calculated from the planned entry and stop.
For that reason, position sizing should be based on the amount of capital a trader is prepared to place at risk, not simply on how many contracts available margin allows the account to hold.
Performance-bond requirements can also change as market conditions change, and brokerage firms may impose requirements above the exchange minimum.
When the scenario is invalidated
A risk-first setup needs a condition under which the original idea is considered wrong.
In this example, the bearish continuation thesis depends on a retracement encountering resistance and failing before the larger structure is reversed.
A sustained recovery above the predefined invalidation area would weaken that thesis.
At that point, the correct response is not to move the stop repeatedly higher because the trader remains convinced that prices should eventually fall.
The evidence has changed.
The scenario should be reassessed.
The opposite is also true at the target side. If price reaches the projected 102 area without first retracing toward the potential entry zone, the setup described here simply never activated.
The framework does not require participation in every move.
It requires the market to provide both directional evidence and acceptable location.
Breakout first, location second
Breakouts matter because they reveal information about market structure.
But knowing the likely direction of a trend and knowing where risk can be efficiently defined are separate analytical problems.
The ZN monthly chart illustrates how those two decisions can be separated.
The break below the October 2023 low provides evidence of bearish continuation.
The Fibonacci extension around 102'06'5, combined with nearby support around 102'02'0, identifies an area where a reaction could become possible.
A rebound toward the 108'18'0 to 109'09'5 region could then create a location from which the continuation thesis may be reassessed with predefined risk.
The broader lesson applies far beyond Treasury futures:
Let the breakout provide information.
Let the retracement improve location.
Define invalidation before position size.
And evaluate the trade through risk and potential reward rather than through conviction alone.
Data Consideration
When charting futures, the data provided could be delayed. Traders working with the ticker symbols discussed in this idea may prefer to use CME Group real-time data plan on TradingView: tradingview.com/cme - This consideration is particularly important for shorter-term traders, whereas it may be less critical for those focused on longer-term trading strategies.
General Disclaimer
The trade ideas presented herein are solely for illustrative purposes forming a part of a case study intended to demonstrate key principles in risk management within the context of the specific market scenarios discussed. These ideas are not to be interpreted as investment recommendations or financial advice. They do not endorse or promote any specific trading strategies, financial products, or services. The information provided is based on data believed to be reliable; however, its accuracy or completeness cannot be guaranteed. Trading in financial markets involves risks, including the potential loss of principal. Each individual should conduct their own research and consult with professional financial advisors before making any investment decisions. The author or publisher of this content bears no responsibility for any actions taken based on the information provided or for any resultant financial or other losses.
A breakout can tell us something important about direction without necessarily telling us where to enter.
That distinction matters because traders often treat the moment of a breakout as both a directional signal and an entry signal. Those are not the same thing. A market can produce strong evidence that a trend is continuing while simultaneously offering unattractive trade location.
The monthly chart of 10-Year T-Note futures provides a useful case study. It shows a major high established in March 2020, followed by a prolonged decline into an important low in October 2023. The market then recovered into September 2024 before turning lower again.
More recently, price moved below the October 2023 low. On a monthly chart, breaking a level that had defined the bottom of a multi-year structure is more significant than breaking a short-term swing.
CME Group market commentary dated September 24, 2026 also reported 10-Year T-Note futures falling to new contract lows as the U.S. 10-year Treasury yield reached 5.15%, its highest level since 2007.
That evidence strengthens the bearish structural case. But it does not automatically make the current price an attractive place to establish a position.
The reusable lesson is simple:
A breakout can establish direction. A retracement can improve location.
Using extensions to identify the next decision area
One way to examine where a strong directional move could encounter a reaction is through Fibonacci extensions.
On the chart, the extension is constructed from the March 2020 high to the October 2023 low, with the projection beginning from the September 2024 rebound high.
The 38.2% extension appears around 102'06'5.
Very close to that projection is an independently identified UFO support area around 102'02'0.
That creates a potentially meaningful decision zone.
The importance is not that two analytical tools somehow guarantee a reversal. They do not. The value is that two different methods identify approximately the same area, giving us a location where observing the market's reaction may become particularly informative.
If the broader decline reaches this region, selling pressure could temporarily weaken and a rebound could develop.
But a reaction from support is not necessarily a reversal of the larger trend.
That distinction becomes the bridge between the breakout and a possible retracement setup.
A reaction can create the next setup
Suppose price reaches the 102 area and begins to recover.
A trader who remains focused on the larger bearish structure would not necessarily interpret that rebound as evidence that the downtrend has ended. Instead, the rebound could be treated as a retracement within the larger decline.
The Fibonacci retracement drawn from the October 2023 low to the September 2024 high helps map that possibility.
The 61.8% retracement sits near 109'09'5, while the nearby UFO resistance structure highlighted on the chart begins around 108'18'0. Rather than treating either price as an exact turning point, these levels can be viewed as a broader decision area.
That gives us a sequence:
Breakout first.
Potential reaction at projected support.
Retracement toward resistance.
Then reassessment of whether the original bearish structure remains intact.
This is very different from simply selling because price has broken support.
Why waiting can change the trade geometry
At the time of the chart capture, ZN was trading around 104'23'5.
Imagine establishing a short position immediately around that price while using an invalidation level near 113'00'0 and the 102'06'5 extension as the potential target.
The distance to the stop would be much larger than the remaining distance to the target. Direction might still be correct, but the trade geometry would be unattractive.
Now consider an alternative hypothetical scenario.
Suppose price first rebounds toward the upper part of the 108'18'0 to 109'09'5 resistance area, and an illustrative short entry is considered at 109'09'5.
Using 113'00'0 as an illustrative invalidation level and 102'06'5 as the potential target creates a very different structure.
The distance from 109'09'5 to 113'00'0 is approximately 3.70 points.
The distance from 109'09'5 to 102'06'5 is approximately 7.09 points.
That produces an illustrative reward-to-risk ratio of roughly 1.9 to 1 before transaction costs and possible slippage.
Nothing about the market's directional outlook has changed between the two examples.
Only the entry location has changed.
That is the core lesson.
Improving reward-to-risk does not have to mean forcing an unrealistically tight stop. It can instead mean waiting for price to come to a location where a logically placed invalidation level requires less risk relative to the potential target.
Of course, there is a trade-off: the retracement may never happen.
In that case, there is no setup under this framework.
Missing a move is different from accepting poor trade geometry simply because the market is moving.
Risk comes before conviction
It is tempting to think that stronger directional conviction justifies taking more risk.
A risk-first process reverses that logic.
The sequence becomes:
First define where the market thesis would no longer make sense.
Then calculate the distance between the potential entry and that invalidation point.
Then calculate the distance to a realistic target.
Only after those quantities are known can position size be considered.
In our illustrative scenario, a move from 109'09'5 to the 113'00'0 invalidation level represents approximately $3,703 of price risk per ZN contract before slippage and costs.
The potential move from 109'09'5 to 102'06'5 represents approximately $7,094 per contract.
Those dollar values become easier to understand once we decode the unusual way Treasury futures are quoted.
Why Treasury prices look unusual
Someone accustomed to stocks, currencies or many other futures markets may initially find a quote such as 102'06'5 confusing.
It should not be read as the ordinary decimal number 102.065.
10-Year T-Note futures follow the long-standing U.S. government bond-market convention of quoting fractional points in 32nds.
For ZN, one full price point is worth $1,000 per contract.
One thirty-second of a point is therefore worth:
$1,000 ÷ 32 = $31.25.
The minimum outright price movement in ZN is half of one thirty-second, or 1/64 of a point.
That tick is worth $15.625 per contract.
So 102'06'5 means:
102 points + 6.5/32 of a point.
Expressed as a conventional decimal price:
102 + 6.5 ÷ 32 = 102.203125.
The same logic applies to other levels on the chart.
102'02'0 equals 102.0625.
108'18'0 equals 108.5625.
109'09'5 equals 109.296875.
This fractional notation is not an oddity created by the futures contract. CME Treasury futures follow the quotation convention of the underlying U.S. government bond market.
Once that convention is understood, the price becomes straightforward to translate into dollar risk.
From fractions to position risk
Consider the illustrative entry at 109'09'5 and stop at 113'00'0.
The difference is 3.703125 price points.
Because one full point in ZN represents $1,000:
3.703125 × $1,000 = $3,703.125 per contract.
The same calculation can be expressed in ticks.
A ZN tick is 1/64 of a point.
The entry-to-stop distance is 237 ticks.
237 × $15.625 = $3,703.125.
The potential move from the entry to 102'06.5 is 454 ticks.
454 × $15.625 = $7,093.75.
The resulting ratio is approximately:
454 ÷ 237 = 1.92.
Understanding the quotation format therefore is not merely a matter of reading the chart correctly. It directly affects stop calculations, position sizing and the interpretation of monetary risk.
Margin is not the same as risk
ZN has a face value at maturity of $100,000 per contract.
At the time of writing, the CME maintenance performance-bond requirement associated with the outright contract was approximately $1,875.
Those amounts should not be confused with maximum trade risk.
Margin is collateral required to support the futures position. It does not define how much a position can lose.
Our illustrative stop distance alone represents about $3,703 per contract, already larger than the maintenance performance bond.
In addition, a stop order cannot guarantee execution at the exact stop price. Rapid market movement, overnight developments or gaps can create slippage, meaning realized losses may exceed the amount calculated from the planned entry and stop.
For that reason, position sizing should be based on the amount of capital a trader is prepared to place at risk, not simply on how many contracts available margin allows the account to hold.
Performance-bond requirements can also change as market conditions change, and brokerage firms may impose requirements above the exchange minimum.
When the scenario is invalidated
A risk-first setup needs a condition under which the original idea is considered wrong.
In this example, the bearish continuation thesis depends on a retracement encountering resistance and failing before the larger structure is reversed.
A sustained recovery above the predefined invalidation area would weaken that thesis.
At that point, the correct response is not to move the stop repeatedly higher because the trader remains convinced that prices should eventually fall.
The evidence has changed.
The scenario should be reassessed.
The opposite is also true at the target side. If price reaches the projected 102 area without first retracing toward the potential entry zone, the setup described here simply never activated.
The framework does not require participation in every move.
It requires the market to provide both directional evidence and acceptable location.
Breakout first, location second
Breakouts matter because they reveal information about market structure.
But knowing the likely direction of a trend and knowing where risk can be efficiently defined are separate analytical problems.
The ZN monthly chart illustrates how those two decisions can be separated.
The break below the October 2023 low provides evidence of bearish continuation.
The Fibonacci extension around 102'06'5, combined with nearby support around 102'02'0, identifies an area where a reaction could become possible.
A rebound toward the 108'18'0 to 109'09'5 region could then create a location from which the continuation thesis may be reassessed with predefined risk.
The broader lesson applies far beyond Treasury futures:
Let the breakout provide information.
Let the retracement improve location.
Define invalidation before position size.
And evaluate the trade through risk and potential reward rather than through conviction alone.
Data Consideration
When charting futures, the data provided could be delayed. Traders working with the ticker symbols discussed in this idea may prefer to use CME Group real-time data plan on TradingView: tradingview.com/cme - This consideration is particularly important for shorter-term traders, whereas it may be less critical for those focused on longer-term trading strategies.
General Disclaimer
The trade ideas presented herein are solely for illustrative purposes forming a part of a case study intended to demonstrate key principles in risk management within the context of the specific market scenarios discussed. These ideas are not to be interpreted as investment recommendations or financial advice. They do not endorse or promote any specific trading strategies, financial products, or services. The information provided is based on data believed to be reliable; however, its accuracy or completeness cannot be guaranteed. Trading in financial markets involves risks, including the potential loss of principal. Each individual should conduct their own research and consult with professional financial advisors before making any investment decisions. The author or publisher of this content bears no responsibility for any actions taken based on the information provided or for any resultant financial or other losses.

Trade Smarter — See What Most Traders Don’t. Explore AutoClimate™ and AutoUFOs® (patented) in the UFO Trading Suite: tradingview.com/spaces/traddictiv/
相關出版品
免責聲明
這些資訊和出版物並非旨在提供,也不構成TradingView提供或認可的任何形式的財務、投資、交易或其他類型的建議或推薦。請閱讀使用條款以了解更多資訊。
Trade Smarter — See What Most Traders Don’t. Explore AutoClimate™ and AutoUFOs® (patented) in the UFO Trading Suite: tradingview.com/spaces/traddictiv/
相關出版品
免責聲明
這些資訊和出版物並非旨在提供,也不構成TradingView提供或認可的任何形式的財務、投資、交易或其他類型的建議或推薦。請閱讀使用條款以了解更多資訊。