
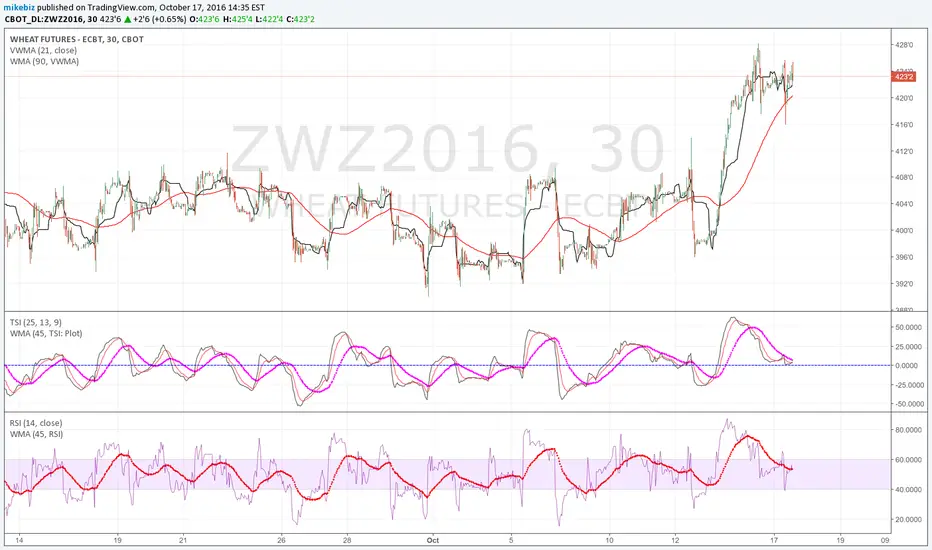
Looking at 30M chart, it's possible that wheat has made its pullback. The TSI could be finding support at 0 and RSI on 40. Based on next open and if these indicators move up off this support may try a dec wheat call.
Looking at the daily chart, the RSI and TSI look bullish and the ADX with +DMI looks like it could be setting up a change in dominance from down trend.

Daily looks like it hit some resistance at the 23.6% retrace area between the 6/8 high and 8/31 low. I think that price will move up to challenge other areas of retrace as noted on daily chart.
Looking at the daily chart, the RSI and TSI look bullish and the ADX with +DMI looks like it could be setting up a change in dominance from down trend.
Daily looks like it hit some resistance at the 23.6% retrace area between the 6/8 high and 8/31 low. I think that price will move up to challenge other areas of retrace as noted on daily chart.

免責聲明
這些資訊和出版物並非旨在提供,也不構成TradingView提供或認可的任何形式的財務、投資、交易或其他類型的建議或推薦。請閱讀使用條款以了解更多資訊。