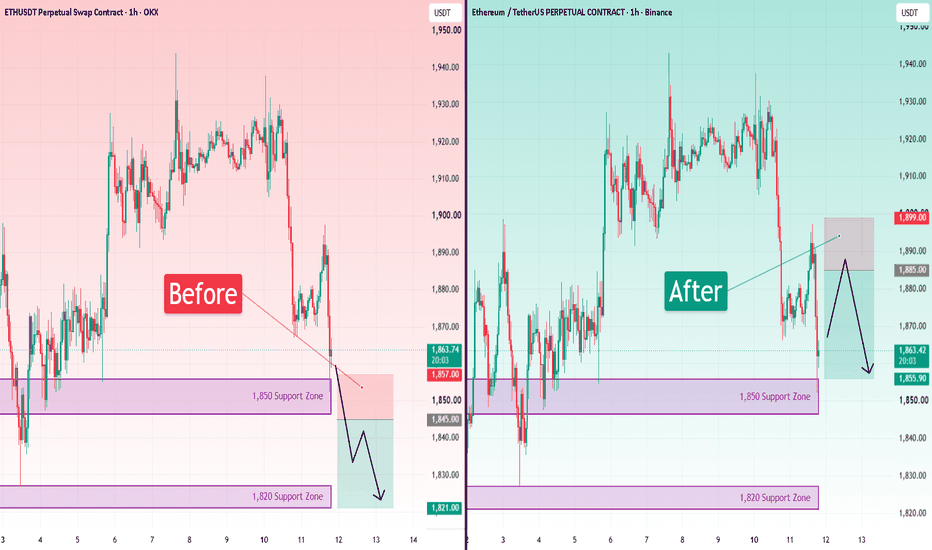
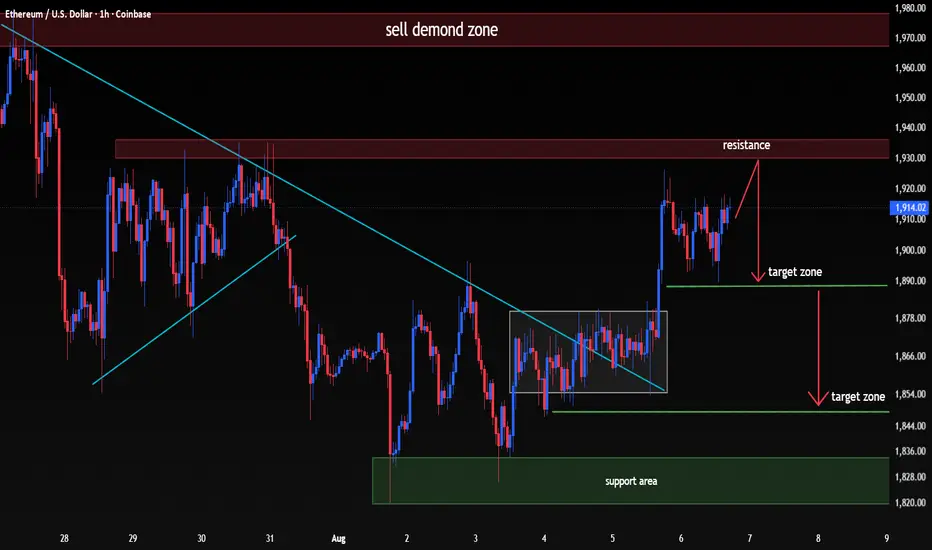
ETH: Why the 1,845 Support Breakout Short Is FlawedThe 1,850 support break made a 1,845 short with 1,821 TP and 1,857 SL look straightforward to me. Then I found the entry was selling into overlapping support, so I reconstructed the entire trade.
The flaw was in the trade construction, not the bearish thesis. At 1,845, I would be selling after price had already pushed into overlapping 4h and 1h support, while the 4h trend was still up and the 1h trend sideways.
I shifted the entry to 1,885, inside the fresh 15m bearish FVG at 1,880.63-1,885.44
Bill Williams Indicators
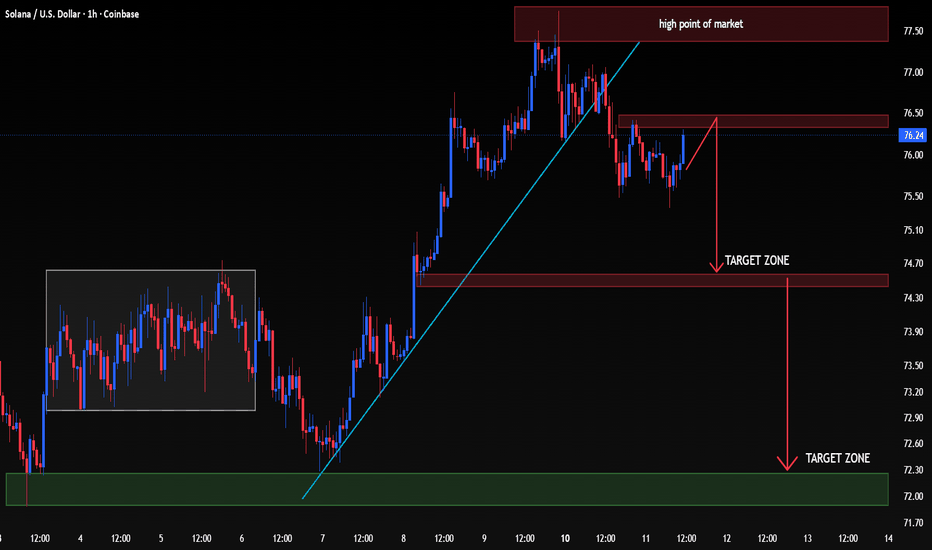
SOL/USD | SELL SETUP...🟣 SOL/USD | SELL SETUP
📍 Sell Entry Zone: 76.20 – 76.50
🛑 Invalidation: 76.70+ on strong breakout
🎯 Downside Targets:
TP1: 74.60
TP2: 72.20
📊 Market Analysis:
SOL is showing rejection after failing to sustain the recent bullish move near the 76.50 resistance area. Price has also broken below the rising trendline, suggesting that bullish momentum is weakening. If the 76.20–76.50 resistance zone continues to hold, sellers may push price toward the 74.60 support zone first. A confirmed break be
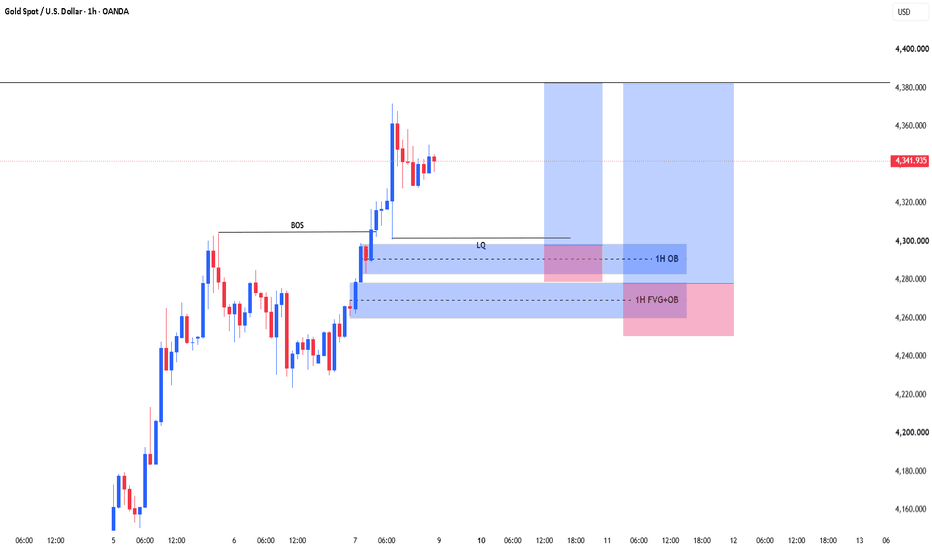
XAUUSD 1H — BOS, Liquidity & FVG/OB Reaction📊 Market Structure
Gold has established a bullish intraday structure, with price breaking above the previous BOS level around 4,300 and continuing toward the 4,360–4,370 area.
💧 Liquidity Area
The marked LQ zone around 4,290–4,305 is an important reference area. A return into this region could help determine whether the previous breakout remains structurally supported.
🟥 1H Order Block
The 1H OB around 4,280–4,300 represents the first area to monitor for a potential reaction if price retrac
Can Ethereum hold $1,870—or is another leg down loading? 📉Can Ethereum hold $1,870—or is another leg down loading?
ETH just took a brutal hit, dumping from above $1,920 and slicing through the SMA 50 at $1,884 and SMA 200 at $1,909. Price is now fighting to stabilize around $1,876, directly above the crucial $1,870 support.
The broader market is turning defensive ahead of tomorrow’s U.S. inflation report. Geopolitical uncertainty remains in the background, while Ethereum’s work on privacy and quantum resistance is a long-term story—not enough to sto
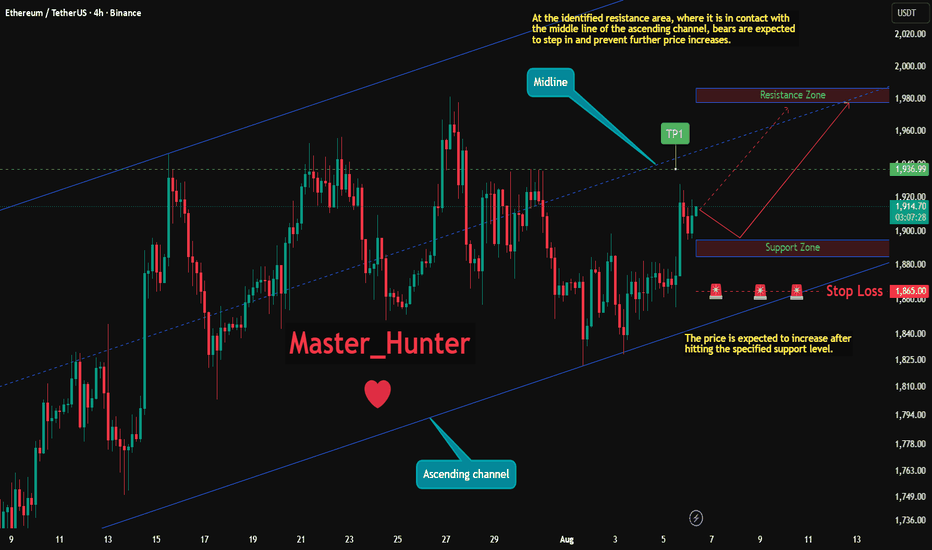
ETHUSDT: Bullish Push to 1978?BINANCE:ETHUSDT is eyeing a bullish continuation on the 4-hour chart , with price approaching a key support zone within the ascending channel after recent pullback, converging with a potential entry area that could ignite upside momentum if buyers defend amid volatility. This setup suggests a solid rally opportunity toward the upper resistance zone with close to 1:3 risk-reward .🔥
Entry between 1885–1895 (entry from current price with proper risk management is recommended). Target at 19
ETHUSD: The crowd bought calm before the panic candleETHUSD: The crowd bought calm before the panic candle
🧠Duck Psychology
On 5 August, ETH jumped from the 1,860–1,875 area into the 1,910–1,925 zone.
The crowd read the bounce as relief.
Some traders read it as confirmation.
And late bulls started buying the calm.
But calm is not the same as control.
By 10 August, ETH was still sitting near 1,910–1,925, but buyers could not extend the move. Then the pond cracked: price dropped sharply toward 1,853–1,870.
🦆Crowd Quack
This is classic t
ETHUSD: Breakdown or Oversold Bounce?📊 ETHUSD: Breakdown or Oversold Bounce?
ETHUSD failed near the $1,920-$1,931 resistance zone and sold off sharply toward $1,865-$1,870.
The move came with a clear volume spike, which means this was not a random pullback. Sellers became aggressive once price lost the moving averages.
Volume increased strongly during the breakdown, confirming bearish pressure. The current bounce has weaker volume, so buyers still need confirmation.
Price is now below EMA9, EMA20, SMA50 and SMA200, which keeps
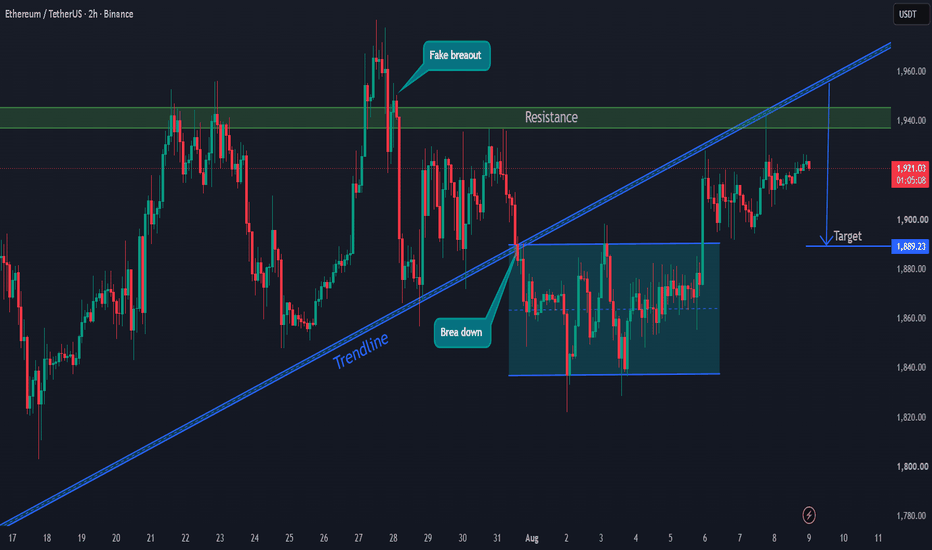
ETH/USDT – Bearish Breakdown Below Rising TrendlineETH/USDT on the 2H chart shows a clear rejection from the 1,940–1,945 resistance zone after a fake breakout. Price then broke below the ascending trendline, signaling a potential shift toward bearish momentum.
The current structure suggests a possible move lower if resistance around 1,940 continues to hold. The highlighted range indicates consolidation following the trendline breakdown.
🎯 Target: 1,889.23 USDT
🛑 Key Resistance: 1,940–1,945 USDT
📉 Bias: Bearish below resistance
⚠️ A sustained m
ETHEREUM THIRD TESTEthereum is once again testing the rising base that has defined the entire 2022 to 2026 structure. This is the third major interaction with that support after the 2022 bottom and the 2025 retest, while the 2021 ATH around $4,800 continues to act as the long term ceiling.
The comparison with Netflix and Amazon is not about identical price action. It is about sequence. Both assets spent years below an old high, built progressively higher structural lows, failed repeatedly at the same ceiling, the
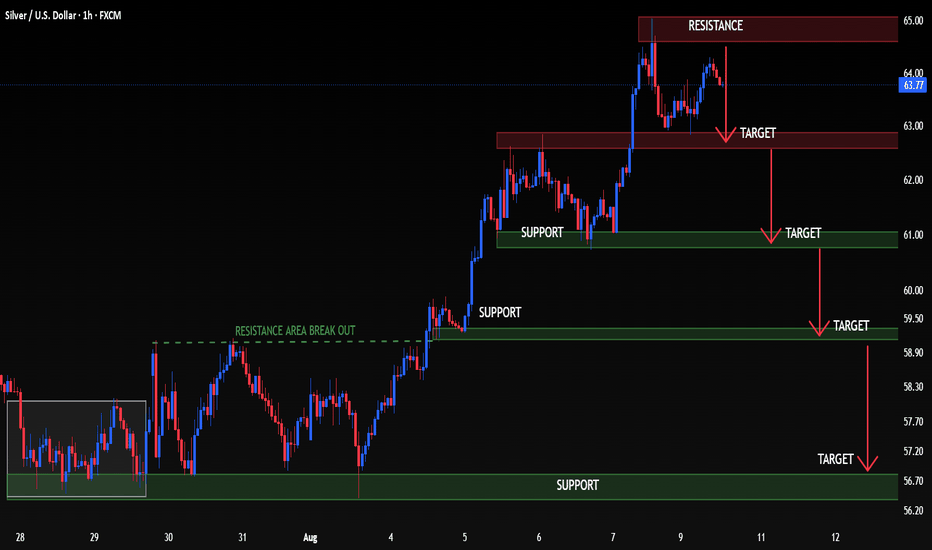
XAGUSD | SILVER | SELL SETUP...
🥈 XAGUSD | SILVER | SELL SETUP
📍 Entry Zone: 63.80 – 64.30
🎯 Profit Targets:
TP1: 62.80
TP2: 61.00
TP3: 59.50
🛡️ Risk Control: 65.10
📊 Market View:
Silver is trading close to the 64.50–65.00 resistance zone after a strong bullish move. Price is showing hesitation near this supply area, which can create a potential bearish pullback. If sellers gain control and price moves below the 62.80 support area, the downside can extend toward 61.00 and then 59.50. A sustained breakout above 65.00 wou
ETHUSD: Major Channel to Determine Next Formation!Hello Community,
welcome to my new analysis of ETHUSD from a weekly timeframe perspective. ETHUSD is the second-largest cryptocurrency, and throughout the past cycles, with many ups and downs, it has held its value substantially. Nonetheless, there are important factors that are necessary to watch out for when considering the upcoming price developments. I have spotted the pivotal signs and underlying factors.
When looking at my chart, we can see how ETHUSD is trading within this historical a
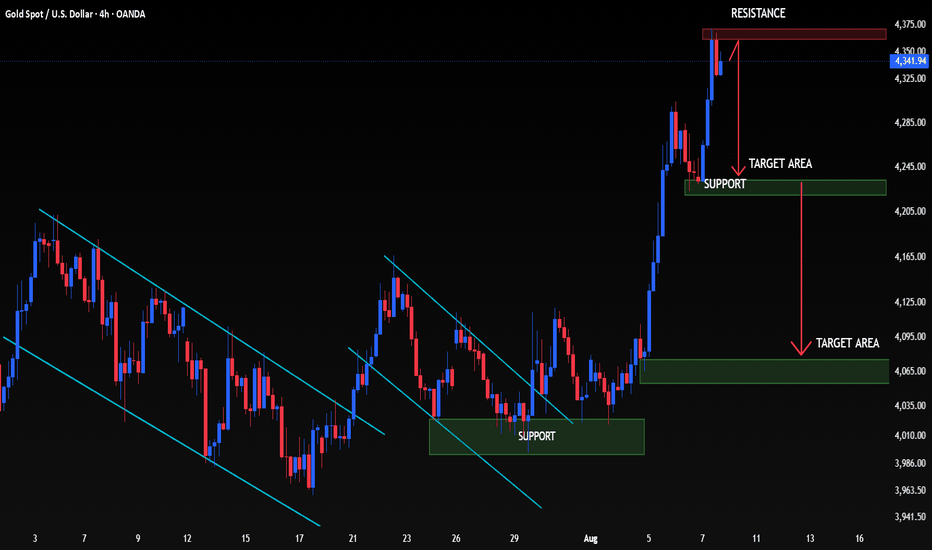
XAUUSD | SELL SETUP (4H)...XAUUSD | SELL SETUP (4H)
📍 Entry Zone: 4340 – 4370
🎯 Targets:
TP1: 4240
TP2: 4095
🛑 Risk Control: 4380
📊 Market View:
Gold is testing the major 4375 resistance zone after a strong bullish move. Price is showing hesitation near this area, creating a potential rejection setup. If sellers gain control and price breaks back below the nearby support, the first downside objective is 4240, while continued bearish pressure could extend the move toward 4095.
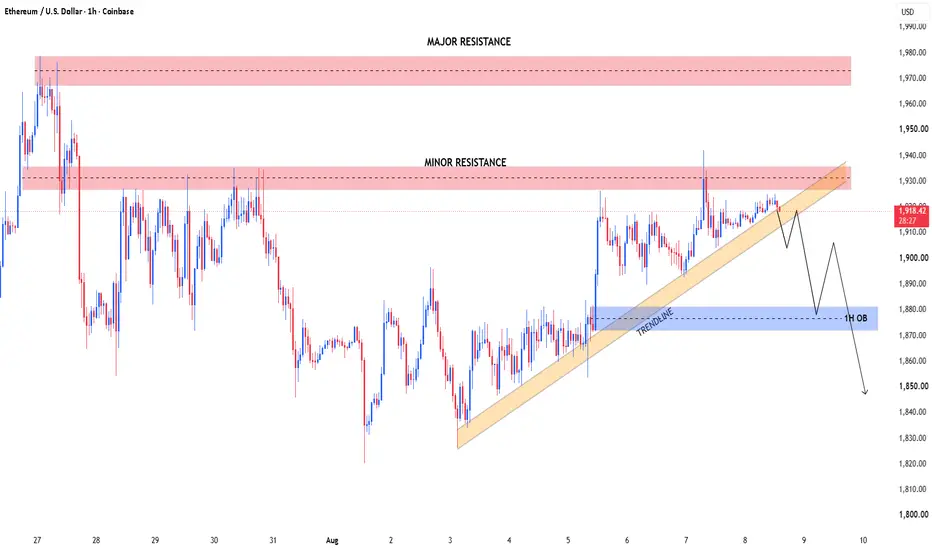
ETH/USD — 1H Market Structure Analysis🔎 Technical Overview
ETH/USD is currently trading around 1,919, with price maintaining a short-term ascending structure from the August 3 low. The rising trendline is acting as dynamic support while price approaches an important resistance area.
🟥 Resistance Zones
Minor Resistance: 1,927–1,937
Major Resistance: 1,967–1,978
The minor resistance is the immediate decision area. A sustained move above it could shift attention toward the major resistance zone.
🟦 Support / Demand
Ascending trendli
ETHUSD Will Go Lower From Resistance! Short!
Here is our detailed technical review for ETHUSD.
Time Frame:9h
Current Trend: Bearish
Sentiment: Overbought (based on 7-period RSI)
Forecast: Bearish
The market is approaching a significant resistance area 1,918.23.
Due to the fact that we see a positive bearish reaction from the underlined area, I strongly believe that sellers will manage to push the price all the way down to 1,832.13 level.
P.S
The term oversold refers to a condition where an asset has traded lower in price and has the
Ethereum next expected moves Ethereum is trading at a critical resistance zone where the next breakout or rejection could define the market's direction. A confirmed breakout may invalidate the bearish setup, while rejection could trigger a move toward lower support levels. This analysis is for educational purposes only and not financial advice.
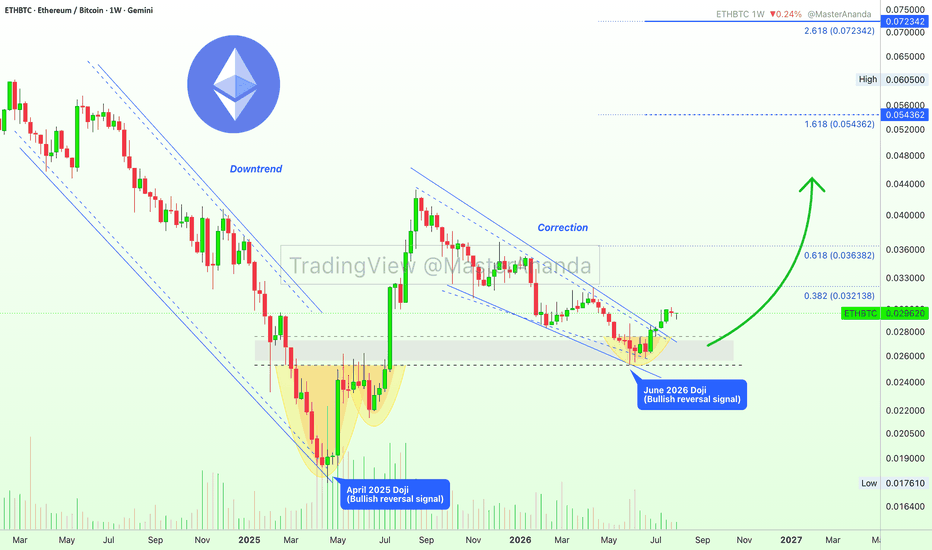
(ETHBTC) Altcoins Market Bullish Reversal Setup: A New CycleThis is a pretty interesting chart. ETHBTC almost works like an index for us. It peaked August 2025. Very strong reversal signals are present on this chart, signaling the end of the correction. Actually, the long-term correction already ended based on technical analysis. When ETHBTC grows, the altcoins market grows.
June 2026 has a perfect reversal signal in the form of a Doji. This Doji produced the lowest price in years, 0.02527, followed by some sideways and later sustained bullish action.
ETH Next Volatility Window: Around August 12 (Aug. 11-13)
Hello, traders.
Follow me to stay updated with the latest market analysis.
Wishing you successful trading.
============================================================
■ ETH VOLATILITY WINDOW: AROUND AUGUST 12
Following the end of BTC's short-term volatility cycle,
the next major volatility window to watch is ETH.
Expected volatility window:
▶ Around August 12
▶ Estimated range: August 11-13
ETH is currently attempting to rebound from its lower price zone.
However, for this move to de
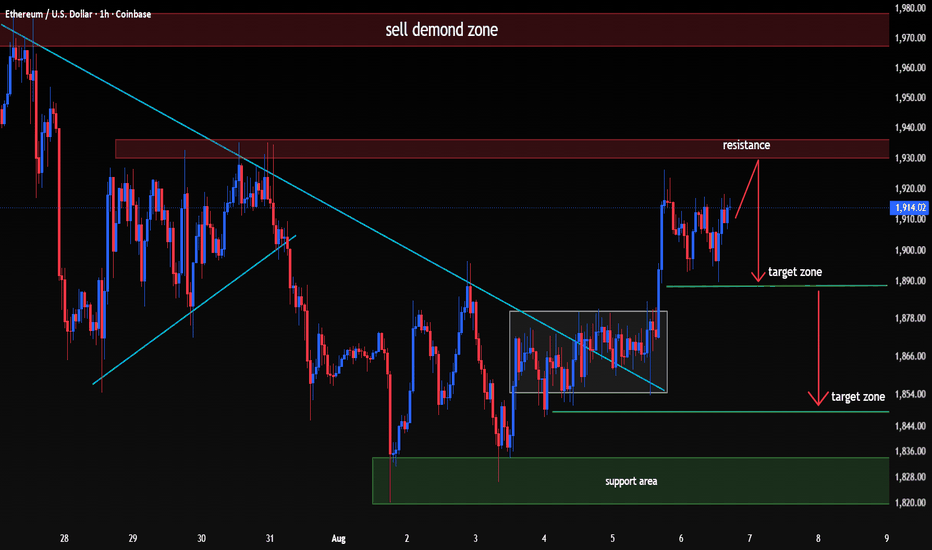
ETHUSD | SELL SETUP (1H)...ETHUSD | SELL SETUP (1H)
📍 Entry Zone: 1912 – 1922
🎯 Profit Targets:
TP1: 1890
TP2: 1848
🛑 Risk Control:
A sustained 1H close above 1935 would invalidate the bearish setup.
Market View:
ETH has rallied into a key resistance zone after a strong impulsive move, where sellers may become active. Price is approaching an area that previously acted as supply, making it a potential rejection point. As long as price remains below 1935, the bearish scenario remains valid, with 1890 as the first downs
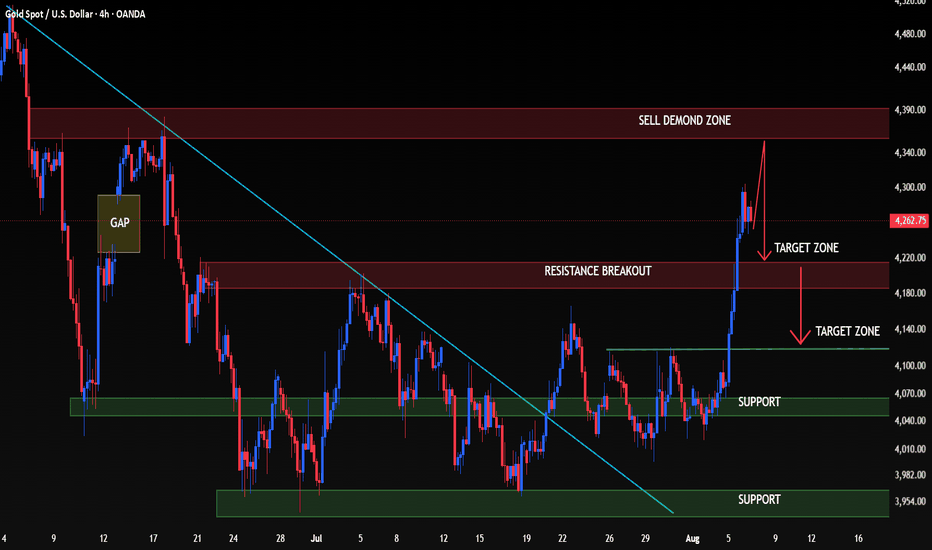
XAUUSD | SELL SETUP (4H)...XAUUSD | SELL SETUP (4H)
📍 Entry Zone: 4260 – 4275
🎯 Profit Targets:
TP1: 4220
TP2: 4140
🛡️ Risk Control:
A sustained 4H close above 4345 would invalidate the bearish setup.
Market View:
Gold has rallied into a higher-timeframe supply zone after a strong impulsive move, where price is likely to face selling pressure. The recent breakout has brought price directly into resistance, making this area important for a potential rejection. If sellers defend the supply zone and price fails to hold
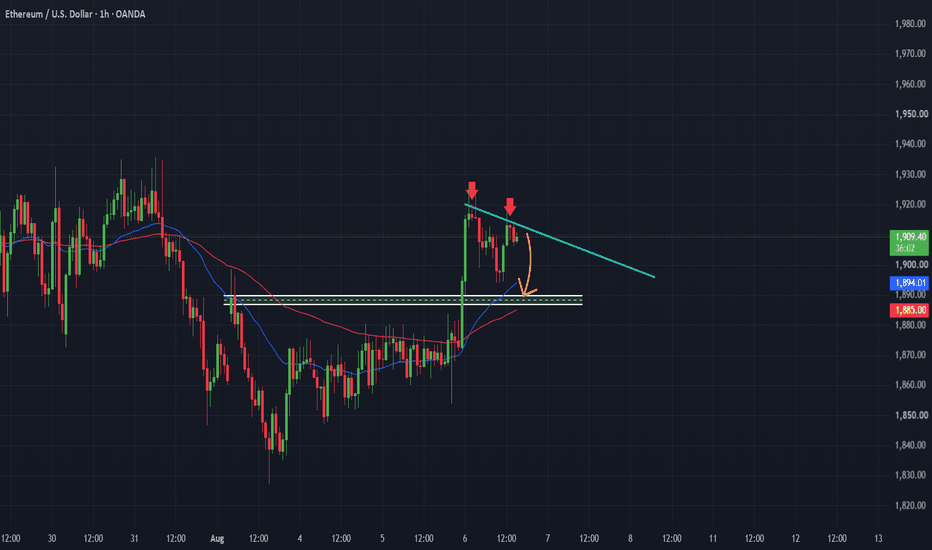
ETHUSD H1: The First Lower High Has AppearedETHUSD failed to maintain buying pressure after the strong rally toward the 1,920 area. Instead of forming a new high, price created its first Lower High (LH), suggesting that bullish momentum is weakening while sellers are beginning to react more aggressively at higher levels.
The appearance of this Lower High just below the short-term descending trendline has interrupted the previous bullish structure. If price continues to face rejection around this area, ETHUSD could correct toward the 1,89