Gold rebound setup: Rebound momentum may be building fast!As expected, gold rebounded and reached the 4360-4380 area, successfully activating my short-selling strategy. Subsequently, it fell back and hit TP: 4325, continuing its decline to a low of around 4270. In the short term, the bears still dominate the market rhythm.
From the current technical structure, gold is undoubtedly in a clear downtrend in the short term. However, what I cannot ignore is the long lower shadows that gold showed around 4268 and 4272 in the short term, which may form a key low support structure. Although this does not mean that the market has reversed, it may alleviate the bearish momentum to some extent and gradually evolve from a strong short-term downtrend into a range-bound trend. In addition, the important support of the current yearly moving average is also located around 4255, and gold is unlikely to break through this support area in the short term.
Therefore, although the downtrend in gold is strong in the short term, the conditions are now in place for the downtrend to gradually evolve into a range-bound movement. So, the momentum for a rebound may be accumulating. However, since the downtrend is currently in control, gold cannot rebound directly all at once. Therefore, the price action will still be volatile and will require time to test and verify before a reversal signal appears.
Short-term technical support levels: 4285-4265 / 4250-4230
Short-term technical resistance levels: 4345-4365 / 4400-4420
Therefore, in short-term trading, we can still try to go long on gold in the 4285-4265 range.  Long
Long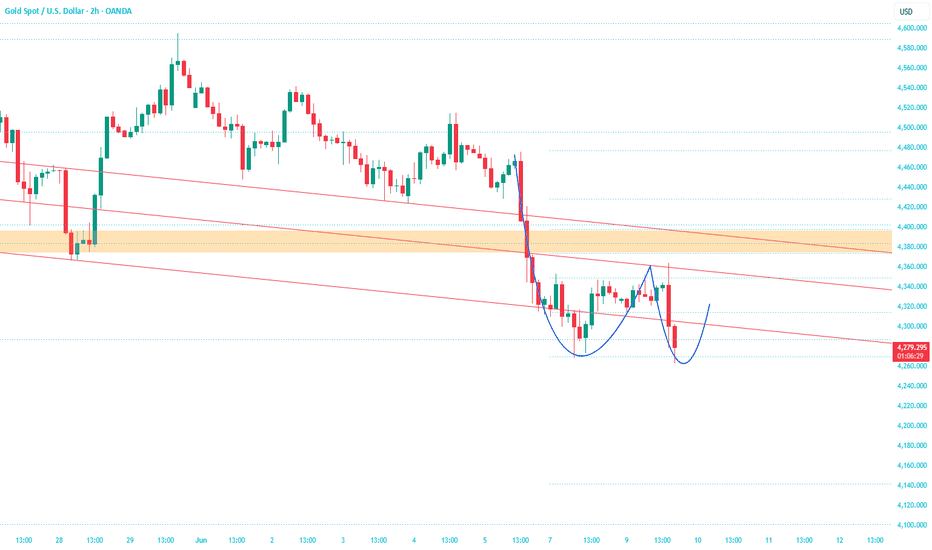
BTCUSDT: liquidity sweep before bearish continuationThe Macro Picture 🗺️
The structural read from late May has fully resolved — BTC didn't just hit the $68,000 target, it blew through it, swept the $60,000 macro floor, and printed RSI in the low 20s for the first time since February's capitulation. What looked like a range-bound consolidation between $66,000 and $82,500 has now revealed itself as a complete distribution structure, and the lower boundary has been broken without ceremony. The question is no longer whether the range holds — it doesn't — but how much open air sits below the swept floor before the next structural reaction.
The Setup ⚙️
The Sweep: The $59,000 wick low cleared the February capitulation reference and every late long stop parked beneath the macro floor — this is the textbook liquidity event that bears were positioning for all along, and bulls were leaning against without conviction.
The Reaction: The current chop above the swept low between $60,000 and $63,000 is post-sweep digestion, not accumulation — without a volume reclaim and without a bullish RSI divergence forming underneath, this consolidation reads as continuation pause rather than structural reversal.
The Trigger: A clean 1D close below $59,000 confirms the breakdown and opens the path of least resistance into a structural air pocket where no horizontal demand sits until the prior macro shelves come into view.
The Roadmap: Primary target sits at $55,000 — the next major demand pocket in open air below the macro floor, where the structural reset can either complete or extend toward deeper liquidity. Invalidation: a sustained 2D close back above $68,000 would invalidate this bearish thesis and trigger a full structural reclaim of the broken range floor.  Short
Short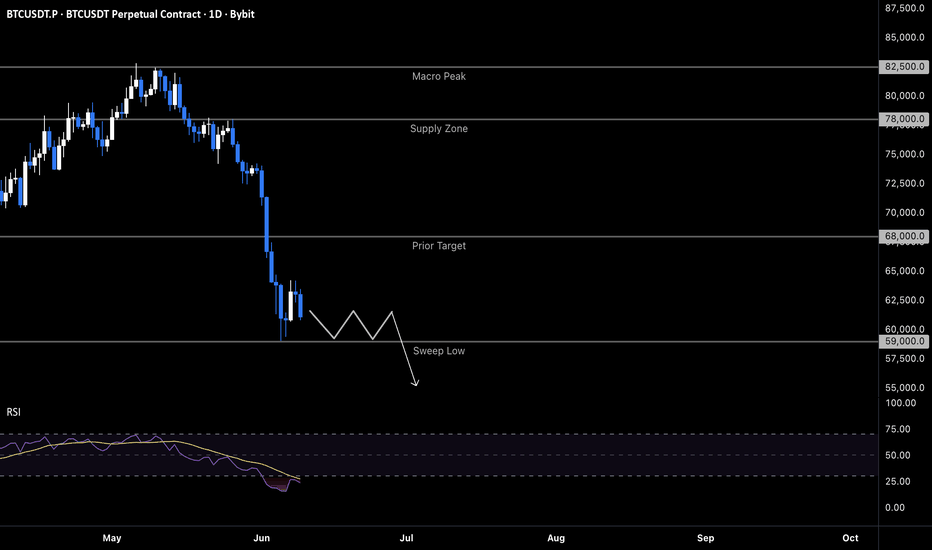
 Short
Short
RUNEUSDT post-sweep reclaim: targeting $0.45The Macro Picture 🗺️
RUNE has completed the structural sweep that the broader range demanded. The June 4 framing called for a defense of the $0.355 macro floor with a reflex bounce higher; instead, price executed the deeper version of that thesis — sweeping liquidity all the way down to $0.30, clearing out late shorts and the last over-leveraged longs, before reclaiming the broken floor from underneath. This is the textbook capitulation pattern: the level that desperately needed to be tested has now been tested below and recovered above, with RSI printing a structural low near 22 at the wick. The bullish destination from June 4 stays intact, just with sweep confirmation now beneath it.
The Setup ⚙️
The Reclaimed Floor: The $0.355 level has been broken and reclaimed from below — the kind of sweep + reclaim that historically marks local bottoms and flips the structural bias back to the upside.
The Squeeze: As indicated by the white projection, the path of least resistance now points toward a tight consolidation just above the reclaimed floor before continuation — bulls accumulate, late shorts get trapped, and momentum coils for the next leg.
The Trigger: A clean push through $0.40 — the first overhead resistance from the broken support flip — would open the runway toward the $0.45 local high magnet where the original June 4 target still sits.
The Roadmap: Primary target sits at $0.45 — as indicated by the white projection, the roadmap points toward the local high magnet once the squeeze resolves higher, with $0.50 as the structural ceiling still capping the broader range. Invalidation: a sustained daily close back below $0.30 would invalidate this bullish thesis and confirm that the sweep was the start of a deeper structural breakdown rather than the bottom.  Long
Long
 Long
Long
 Long
Long
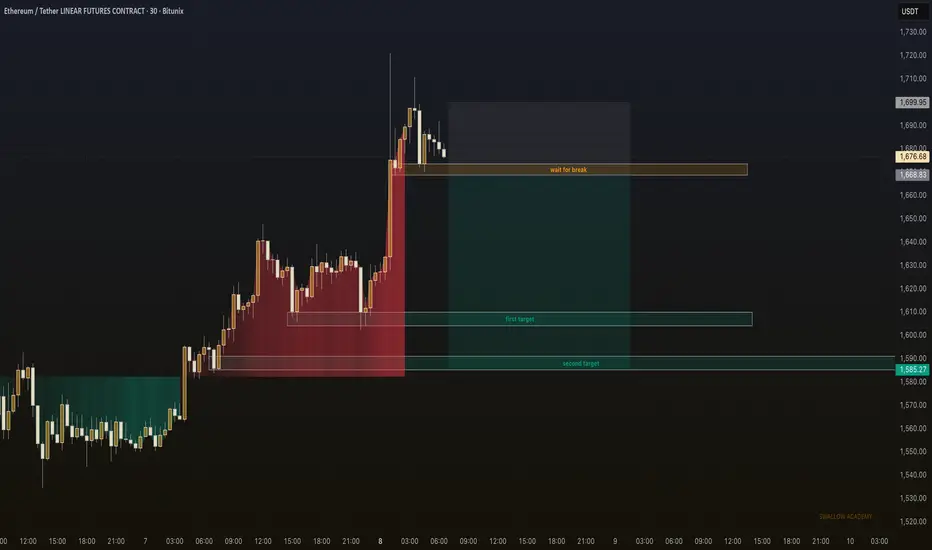
ETHUSDT – Bearish Breakdown Setup Below 1,550, Eyes on 1,425ETH is grinding into the gap fill while pressing right into the local low zone around 1,550 — and that level is the entire trade.
Why This Level Matters:
The 1,550 zone is the base that has held price for the last several sessions. A clean break here flips this support into the launchpad for a much larger downside move, while holding it keeps the range alive.
Gameplan / Primary Scenario:
Sell the breakdown below 1,550 and target the demand zone at 1,425. If sellers crack and close below the zone, treat any retest from underneath as a mega short entry and ride continuation lower. If price bounces off 1,550 instead, watch the 1,675 supply for the next rejection rather than chasing longs.
If this added value, boost it forward. What are your thoughts?
Swallow Academy  Short
Short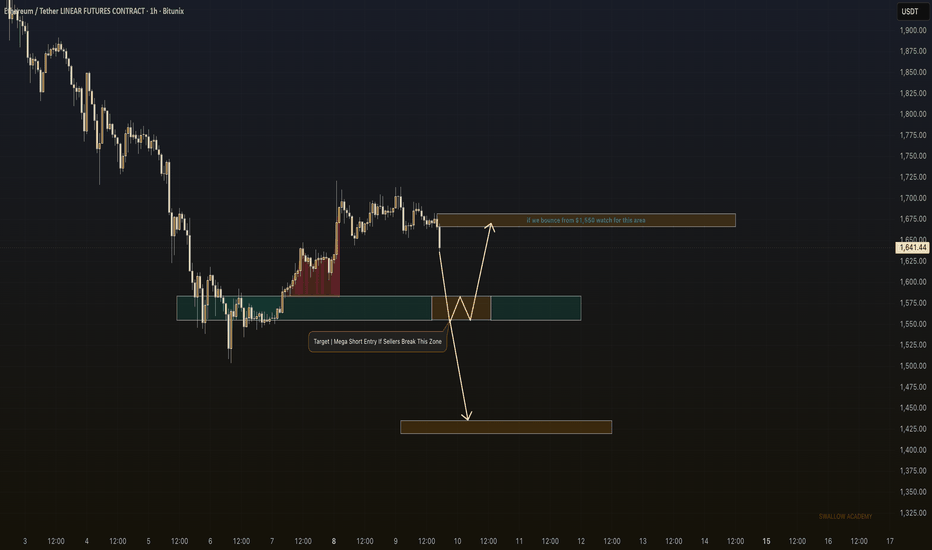
After the breakdown storm, a relief rally may follow!With gold prices breaking through several key lows such as 4360 and 4310, the short-term market has gradually formed a new downward trend. Although there was a rebound after touching the support level near 4260, it was merely a recovery after a sharp drop and did not form a full reversal pattern. Moreover, there are no obvious bottoming signals in the short term. Therefore, I advocate trend-following trading in the short term, focusing on shorting gold at higher levels. However, it should be noted that gold has just experienced a sharp decline, and there may be some speculative funds entering the market to drive a rebound in gold prices, which may continue for some time.
The first resistance level to watch is the 4360-4380 area, followed by the 4400-4420 area. On the downside, the primary support level to watch is the 4265-4245 area, followed by the stabilization around 4300.
Short-term technical support levels: 4310-4290 / 4265-4245
Short-term technical resistance levels: 4360-4380 / 4400-4420
Therefore, in short-term trading, if gold rebounds to 4360-4380, I will first consider shorting gold; if gold returns to consolidation and repair during the pullback, we can consider trying to go long on gold in small batches in the 4310-4290 area. Short 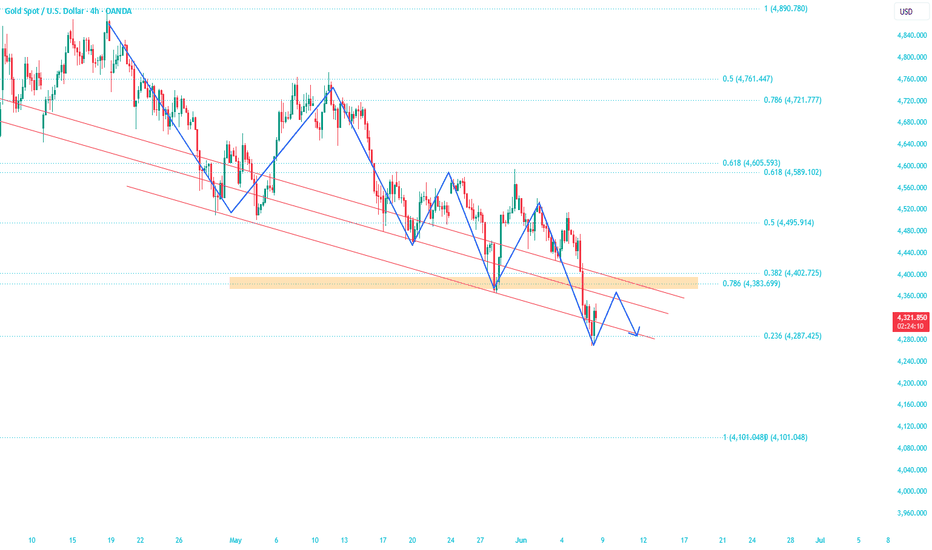
What Are & How to Find High and Low Liquidity Zones in Trading
Liquidity analysis is the essential part of trading Forex, Gold and any other market.
Your ability to identify and differentiate high and low liquidity zones is crucial for spotting profitable trading setups.
In this article, we will go through important Supply & Demand basics.
You will learn how to measure a concentration of market liquidity and orders on different price levels.
What is Liquidity
Let me start with explaining what I mean by the market liquidity.
The orders of the market participants are not equally distributed among different price levels.
While some levels will accumulate the liquidity, some price levels will lack that.
High Liquidity Analysis
One of the proven and the most efficient way to analyse liquidity is based on price action and candlestick analysis.
Let me explain.
Candlestick Analysis & Liquidity
One of the most evident signals of a high concentration of liquidity is a formation of multiple long wicks within the same area.
Long wicks signify a dense participation of buyers and sellers.
It means high market efficiency and that every price level was traded by the buyers and by the sellers.
Multiple candles pushing up to roughly the same high, each leaving a long upper wick will signify a strong concentration of supply and inability of the buyers to breakthrough.
Multiple candles dropping to roughly the same low, each leaving a long lower wick, then closing higher will signify a strong concentration of demand and inability of the buyers to breakthrough.
Price Action Analysis & Liquidity
Price action analysis will help you identify high liquidity zones too.
The levels or the zones from where strong price movements initiate will indicate liquidity concentration.
An area or level from where a rapid bullish movement started will suggest a strong concentration of demand.
Because that level or area contained enough buying orders to absorb all selling pressure and then push price upward rapidly.
An area or level from where a rapid bearish movement started will suggest a strong concentration of supply .
Because that level or area contained enough selling orders to absorb all buying pressure and then push price downward rapidly.
Low Liquidity Analysis
Now, let me explain how to identify low liquidity zones easily.
Strong bullish or bearish candles with tiny or no wicks are a perfect indicator of low liquidity.
High momentum bullish candles with little or no wicks will signify a clear dominance of the buyers with a very low presence of the sellers.
The absence of supply and overwhelming demand will create the market inefficiency , pushing the prices way higher until a high liquidity zone is found.
High momentum bearish candles with little or no wicks will signify a clear dominance of the sellers with a very limited buyers' participation.
The absence of demand and overwhelming supply will create the market inefficiency , pushing the prices way lower until a high liquidity zone is found.
Liquidity Analysis Example
Now let me show you how a complete liquidity analysis should look like.
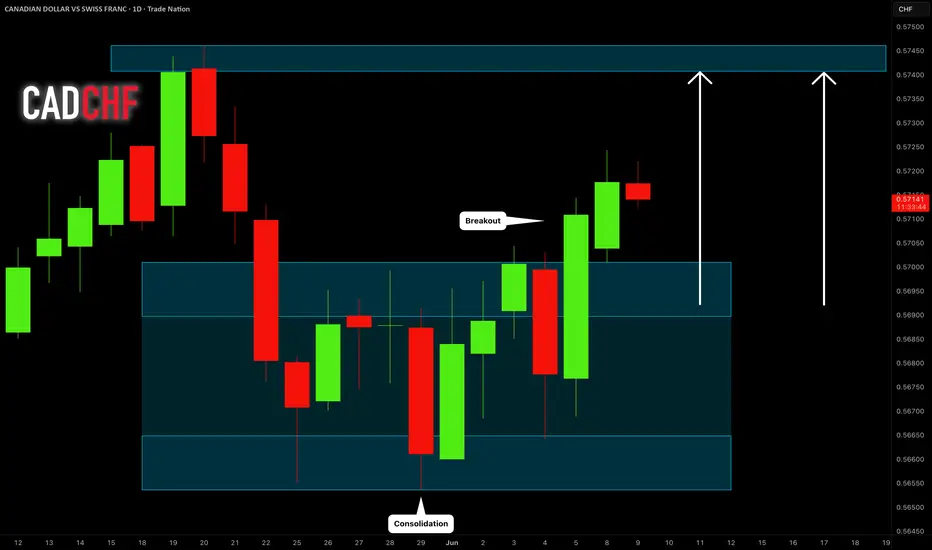
The blue zones above are high liquidity zones on GBPCAD forex pair.
While gray zones are low liquidity zones.
These areas are identified using the rules that we discussed above.
Summary
Price action and candlestick analysis are powerful tools in measuring the market liquidity on different price levels.
It will help you better orient yourself and make more accurate predictions in trading Forex or any other market.
❤️Please, support my work with like, thank you!❤️
I am part of Trade Nation's Influencer program and receive a monthly fee for using their TradingView charts in my analysis.
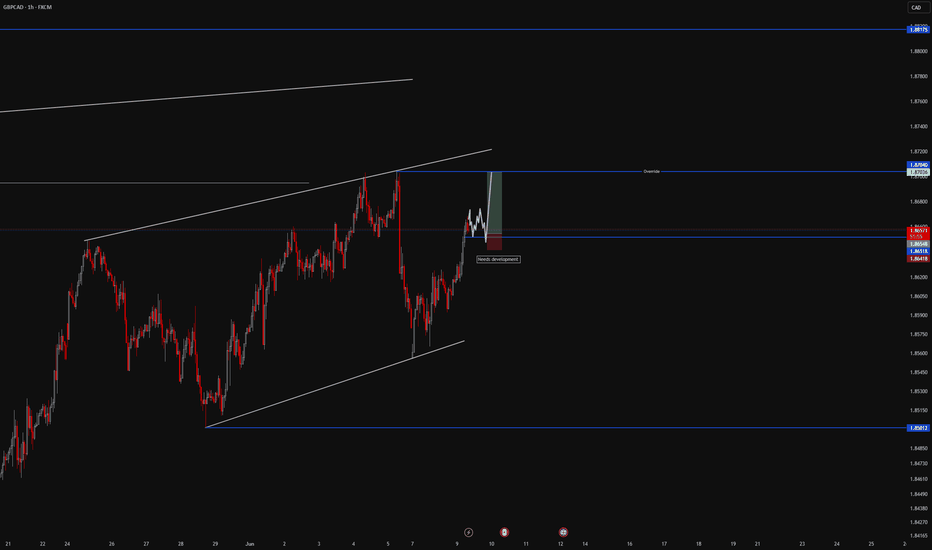
Education 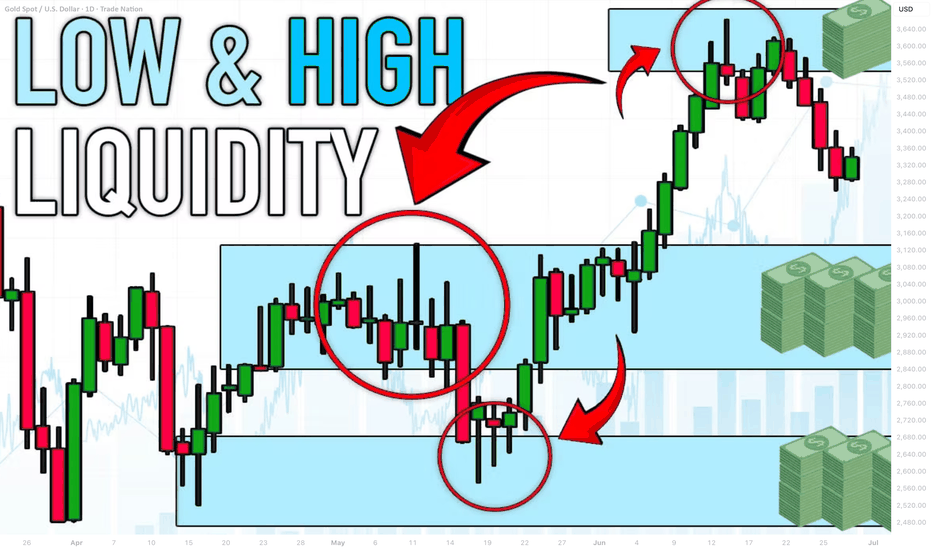
 Long
Long

 Short
Short
Long 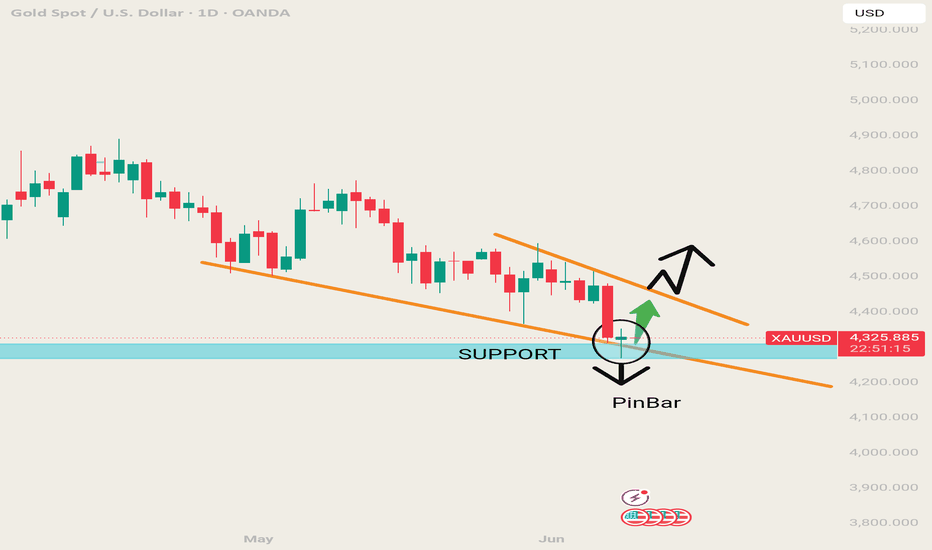
BTC – Bearish Gap Fill Setup Below 63K, Eyes on 61,2KBitcoin is opening a clean shorting setup after last week's strong rally into the weekend gap.
Why This Level Matters:
Price is stalling just under 63,442 after the rally and now sits above an unfilled weekend gap. Gaps like this tend to get filled, and the Main Target Zone near 61,250 lines up perfectly with that fill.
Gameplan / Primary Scenario:
Wait for a market structure break below 62,690 before committing. Once that breakdown confirms, sell the move and ride it lower toward the Main Target Zone at 61,250. The gap fill is the magnet, and the breakdown is the trigger.
If this added value, boost it forward. What are your thoughts?
Swallow Academy Short 
Short 
SP500 failed breakout: targeting $7,200The Macro Picture 🗺️
Six days after the structural target at $7,700 was tagged but never broken, the bullish thesis has been cleanly invalidated by an impulsive flush. Price rejected just beneath the previous trigger, sliced through the $7,500 support flip without hesitation, and broke the ascending trendline that had anchored every higher low since April. RSI dropped from the high 60s into the low 50s in a single move, signaling a genuine momentum shift rather than a shallow pullback. The macro uptrend is not yet dead — but the local structure has shifted, and the chart needs a deeper reset before any continuation thesis becomes credible again.
The Setup ⚙️
The Rejection: The $7,600–$7,650 zone, where price tagged the previous target and reversed sharply, now stands as confirmed local resistance. Bulls who chased the highs are trapped from above, and every push back toward this pocket is likely to be sold rather than absorbed.
The Trap Retest: The $7,500 horizontal — only days ago a support flip — has flipped roles again into ceiling. A shallow bounce back into this level offers bears a high-confluence shorting structure and a textbook setup to trap breakout traders looking to call the bottom too early.
The Trigger: The $7,300 critical floor caught the first impulsive flush on a clean wick — but a single touch rarely settles a level under this kind of pressure. A sustained daily close below $7,300 unlocks the path of least resistance toward open air beneath, where no prior structure provides interim support.
The Roadmap: Primary target sits at $7,200 — as indicated by the white projection, a rejection at $7,500 followed by a break of $7,300 opens the next leg lower toward the underside of the May consolidation. Invalidation: a sustained daily close back above $7,500 would invalidate this bearish thesis and signal that the failed breakout was itself the liquidity sweep, with structure resetting for renewed continuation.  Long
Long

 Long
Long