Silver $61 → $333: Roadmap BeginsThe corrective structure is nearly complete.
Silver is finalizing its Intermediate Wave (2) retracement within Primary Wave 1 of Grand Supercycle Wave 5, approaching the critical 60.70–60.20 confluence zone, validated by the 0.618–0.786 Fibonacci retracement of Wave (1).
Price is currently at $61, on the doorstep of the optimal entry cluster.
Entry Zone : $61.00–60.20 (Wave (2) termination zone)
Invalidation : Below $54.75 (origin of Wave (1))
Once Wave (2) confirms its low within this zon
Elliott Wave
Nasdaq 100: One More Push Higher, or Time for a Bigger Pause?The Nasdaq 100 is back near its September high, but the next move matters more than the fact that it has reached this area. A sustained move above 30,771 could leave room for another advance. A failed breakout would instead raise the possibility that the latest rally has already run its course.
This daily-chart roadmap starts at the October 13, 2022 low. It uses the Nasdaq 100 index, NDX, rather than the Nasdaq Composite or a CFD. The reference close is 30,276.810 on September 28, 2026, from Tr
XAUUSD — Weekly Bearish Map Toward 3,850
Gold is entering next week with a heavy structure after failing to hold above the recovery zone. From Kelly’s view, the chart suggests that XAUUSD is still trading under the larger downtrend pressure, and the current price action looks more like a bearish continuation setup than a confirmed bullish reversal.
The key idea is simple: gold is still below the main sell zone and below the larger downtrend structure. If buyers cannot reclaim resistance, sellers may continue to push price toward the l
Elliott Wave View: Gold (XAUUSD) Working Through Zigzag PatternThe short‑term Elliott Wave view in Gold (XAUUSD) indicates that the cycle from the August 25, 2026 high is unfolding as a zigzag corrective structure. From the August 25 peak, wave A concluded at $4282.23, followed by a rally in wave B that terminated at $4509.59. The metal has since resumed its decline in wave C, which is subdividing into a five‑wave impulse pattern. This development highlights the continuation of corrective pressure within the broader structure.
From the peak of wave B, wave
Iran | When the Value of Money Tells the Story⏱️ Reading Time: ~2 minutes
This is not just a chart about the dollar.
It is a long-term look at the changing value of the Iranian rial against the U.S. dollar.
When we step back and look at USD/IRR over several decades, the scale of this move becomes difficult to ignore.
But Elliott Wave asks a different question:
What is the structure behind the move?
On the chart, the area around 42,000 stands out as an important structural reference. The powerful move that followed raises a larger quest
Silver: The Bullish Case Rests on the Zigzag Family⏱️ Reading time: about 3 minutes
In the bullish case, the current structure could complete with a Simple Zigzag. One reason this scenario remains structurally valid from the perspective of the Elliott Wave Principle is the alternation between corrective waves. The Wave II at the higher degree was an Extended Flat, while the current correction may develop with a sharper and different personality. From a corrective-character perspective, this combination can therefore remain consistent with the pr
Complete Anatomical Breakdown of an Impulse Cycle Step-by-Step🟡 GOLD – 5H | Elliott Wave Educational Series: Part 2 | Complete Anatomical Breakdown of an Impulse Cycle Step-by-Step
Welcome everyone to Part 2 of our in-depth educational series on Elliott Wave Theory and pure Price Action mechanics.
After covering the macro perspective and essential principles in Part 1, today we dive into an exhaustive, hands-on case study on Gold (GOLD) on the 5-hour timeframe. We will dissect the entire bullish impulse cycle from inception to completion, demonstratin
SILVER — Bullish Gartley Harmonic PatternSilver is approaching a very interesting Bullish Gartley harmonic pattern, with price moving into the Potential Reversal Zone (PRZ) around $59–$60.
This is the area I'm watching closely.
Trade Setup
Entry: $59.00–$60.00
TP1: $67.556
TP2: $71.00
TP3: $76.8425
TP4: $86.00
The $59–$60 area is the key PRZ. If the Bullish Gartley completes here and we get confirmation from price action, I believe this could be a very important area for Silver.
What makes this setup especially interesting is the
Episode 09 — When Elliott Began Drawing the Boundaries🎬 Mr. Nobody’s Chronicle
Season I — The History of Elliott Wave Principle
Episode 09 — When Elliott Began Drawing the Boundaries
⏱️ Reading time: ~3 minutes
“If this pattern truly exists, there must be a point where it can no longer continue.”
In the previous episode, we followed Ralph Nelson Elliott deeper into the world of structure.
He was no longer simply watching prices move up and down.
He wanted to understand something deeper.
How was a large movement built from smaller movements?
W
Why Many Elliott Wave practitioners mislabel wave structures? Many Elliott Wave practitioners mislabel wave structures because traditional rules require revision. In Harmonic Elliott Wave, Ian Copsey presents One of the most compelling case for modifying R.N. Elliott's original framework beside few others.. E.g There is no truncated wave 5 etc
Gold Elliott Wave: Waiting for the Next Major OpportunityIn some of the past updates, we discussed that some of the best opportunities on gold can show up when gold makes a solid pullback and, at the same time, gold volatility moves towards the lower side of its range. The reason is that when volatility starts to come down and price action slows, a lot of traders and even major players may start stepping aside and lose interest. But this is actually when traders looking for opportunities ahead of the crowd should start paying more attention.
Looking
Gold: Fear or Structure?⏱️ Reading Time: ~2 minutes
In the market, no structure is carved in stone.
Price itself creates the structure with every move—and as its behavior changes, that structure can change with it.
On the Gold chart, what matters to me is not simply where the market goes next. The real question is:
What structure are the bulls and bears building?
Sometimes price looks calm and corrective, while underneath it, a force is developing that could completely change the path. At other times, a structure
HYPE: Break $98, Open $116.HYPE is currently trading around $90, just below the recent high at $98.013.
That high is the immediate level that matters.
The current Elliott Wave count allows for another advance in Wave (v), but the next leg higher needs confirmation through the recent high.
Technical Structure
The chart gives us a very defined setup:
$98.013 is the breakout level.
A break above that high would strengthen the current Wave (v) interpretation and open the projected upside range between approximately $9
GOLDhi
i think gold have huge move to the up and grab the liquidity(green arrows) then sellers push price down to the weekly area (red arrow)
OR
we have sell pressure at the start and price goes for weekly demand
we have one probability, when price reach in 4h supply area and grab the liquidity on effect of suddenly fundamental news going to the upside and (purple arrow)
my vision for gold now in this situation is sell and any up moves is a chance to sell gold
Near/USD 4H timeframe- possibly a correction of wave 4 on the 4HThere is a good chance Near is entering a wave 4 blue correction the the red box area of Fibonacci 23.6%, and 38.2% and 50% with 38.2% is where I give the most probabilities around 3.95, 4 area).
Confirmation: 4.72
We need the price to move lower than 4.72 to gain more confidence about this plan.
Invalidation: 5.57
If price moves higher than this point, the plan is invalid.
Bitget (BGB): Recently Hacked, What Does The Chart Have to Say?Bitget Token is trading around $1.97, but the weekly structure remains at a critical point.
The current chart does not simply project a straight move lower. Instead, it allows for a corrective bounce first, with $2.1385 and $2.5933 marked as the main upside references, before the larger downside structure resumes.
Fundamental / News Catalyst
The biggest recent fundamental development for BGB is the security incident affecting Bitget itself.
On September 24, Bitget detected unauthorized tra
Gold Tests 61.8% Fibonacci — Is the Correction Almost Over?Gold ( OANDA:XAUUSD ) has been in a bearish trend over the past 6–7 days, but the decline has developed with relatively weak momentum.
Interestingly, the bullish move completed in less than two days has still not been fully retraced after nearly a week of declining prices, suggesting that buyers continue to show relative strength.
Can gold defend the Heavy Support Zone and begin another bullish move, or is a deeper correction approaching?
Macro Outlook
The U.S. 10-Year Treasury Yield(US10Y)
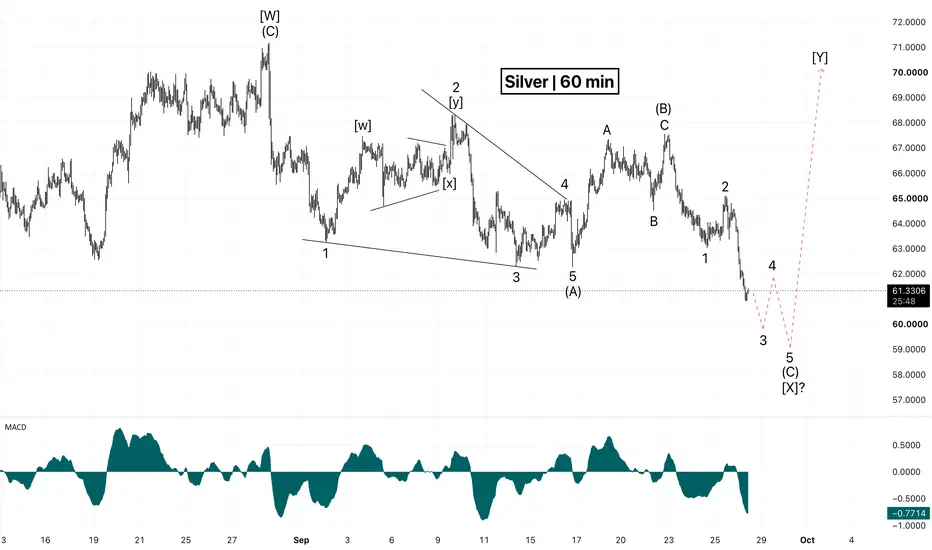
One More Drop Before the Next Rally?Silver remains under pressure in the short term, and the current Elliott Wave structure suggests that the decline may not be complete yet.
On the 60-minute chart, the move from the September 23 high appears to be developing as a five-wave bearish impulse.
We are currently approaching the final stages of this structure. My primary scenario suggests a small wave 4 correction followed by one more decline in wave 5.
🎯 Target zone: $58–59
This move could complete wave (C) and potentially the la
XAUUSD — Strong Bearish Start Inside Channel
Gold is opening the new week with strong bearish pressure after failing to recover above the descending channel structure. From Kelly’s view, the chart suggests that XAUUSD is still trading inside a clear downtrend, and the current movement may continue lower to complete the next bearish Elliott Wave sequence.
The key idea is simple: gold remains below the Sell zone wave 5, and as long as buyers cannot reclaim this area, the bearish channel may continue pushing price toward the lower Fibonacci
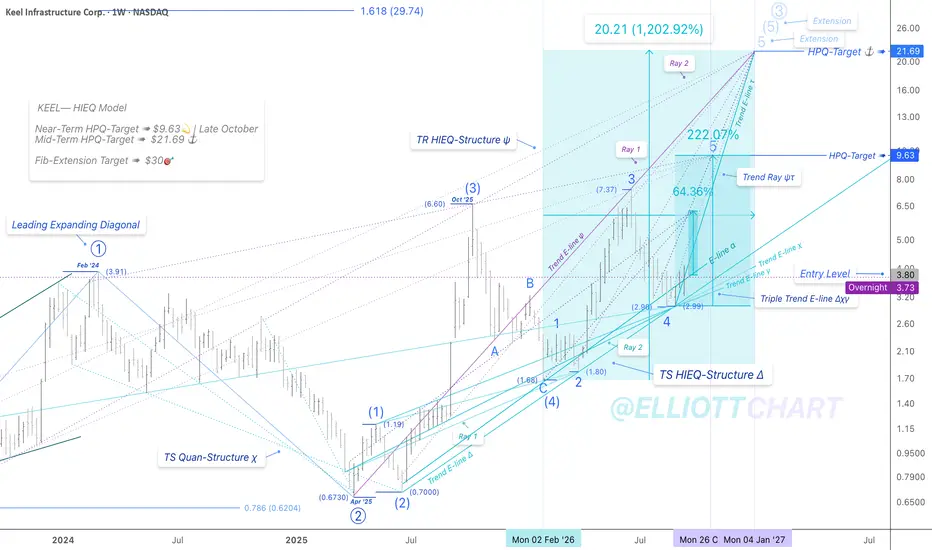
KEEL | WeeklyNASDAQ:KEEL — HIEQ Model
Just Observation | Projecting Impulsive Advance 📈
No specific change to my KEEL analysis—no shift is required. Price bars remain quite stable on the Support Trend E-line α, while steadily tracking along Trend E-line τ, with 64%📈 potential upside projected across the upcoming weekly rallies.
The current zone may still be respected as a potential entry region.
The HPQ Target ➤ $9.63 🎯 remains intact for late October.
The Primary Trend Ray Advance ψτ was first anchored
Foseco India – Assessing the Current CorrectionFoseco India has seen a strong impulsive advance, with the recent peak marking a possible completion of green circle Wave 3.
The subsequent decline appears to be developing as green Wave 4, which is probably still in progress. The lower-degree blue count also suggests corrective price action within this larger Wave 4.
Volume expanded sharply during the preceding Wave 3 advance, while activity has reduced during the current pullback. I’ll be watching how this correction develops before looking