4H Analysis @ 16 Sep 2026+> Analysis of Key Levels for Rejections,
+> Reversal Areas/Zones where market can reverse after completing demand,
+> If there's no confirmation of reversal then market can continue.
* Analysis is for speculation only, it is not a advise or tip of any kind for your hard-earned money to trade or invest.
Fractal
XAUUSD: Trading PathHello to all my fellow followers. Given the upcoming Federal Reserve meeting regarding interest rate hikes, I believe there is still a likelihood that gold’s downward trend will continue. Based on this—and considering supply and demand structures—I have opened a trade, and the final target on the one-hour timeframe is as follows:
XAU/USD 16 September 2026 Intraday AnalysisH4 Analysis:
-> Swing: Bullish.
-> Internal: Bearish.
Bias and analysis to remain the same as analysis dated 30 June 2026.
Price did not print bullish CHoCH to indicate bullish pullback phase initiation. Price instead printed a new low followed by a bullish CHoCH
Price is currently trading within and established internal range, however, I will continue to monitor price with respect to depth of pullback.
Intraday expectation:
Price to trade up to either premium of internal 50% EQ, or
DXY 2H | The Next Structure Will Define the Larger Path⏱️ Estimated Reading Time: About 2 Minutes
Following our daily DXY analysis, we are now moving down to the 2-hour chart to examine what the current movement may be building at the lower degree.
In the bullish scenario, if the recent correction has already completed, the market should now be developing a new Wave 1. Therefore, simply seeing price move higher is not enough. Price needs to break decisively out of the marked black boxes and then develop a valid motive structure.
If that happens,
DXY | When Structure Reveals the Dollar’s Next Path⏱️ Estimated Reading Time: About 2 Minutes
In this update, our focus is on the current DXY structure on the daily chart, where the market is still revealing the pattern following the recent decline.
From the higher-degree perspective, we continue to monitor two scenarios.
🟢 Bullish Scenario
If the current structure completes as a corrective pattern and the market then develops a valid motive structure, the probability of further DXY strength will increase.
A break of the marked levels could
XAUUSD — 4,293 Hold or 4,261 Sweep?
Gold is trading around 4,321 after another weak M30 rotation inside the descending channel.
The short-term bounce has lost momentum below the nearby resistance area, while sellers are still controlling the broader structure under the falling dynamic resistance.
Macro conditions also remain difficult for Gold. Markets are heavily pricing a Fed rate hike this week, Treasury yields remain elevated, and higher oil prices are keeping inflation concerns alive.
But this is also why the lower zones
XAU/USD 15 September 2026 Intraday AnalysisH4 Analysis:
-> Swing: Bullish.
-> Internal: Bearish.
Bias and analysis to remain the same as analysis dated 30 June 2026.
Price did not print bullish CHoCH to indicate bullish pullback phase initiation. Price instead printed a new low followed by a bullish CHoCH
Price is currently trading within and established internal range, however, I will continue to monitor price with respect to depth of pullback.
Intraday expectation:
Price to trade up to either premium of internal 50% EQ, or
Temporal Aspect of FractalityIn this publication, I would like to bring some clarity to the series of my unconventional analysis.
At this stage of my research I have no doubt that market's natural growth patterns can be defined by historic range and power exponents of Phi. Essentially, it's just two overall fib channels that cover structural boundaries of bullruns from ATH to new ATH mapped to bottom as 3rd coordinate. When we have angle of fibs derived from chronological highs, the ratios would cover the levels of oscillat
US100 Sell Setup — Supply Zone RejectionUS100 is currently approaching a clearly identified Supply Zone around 29,600–29,750, where price previously showed a fake breakout and strong bearish rejection. The current bullish move into this area could provide an opportunity for a bearish reversal if sellers step in and confirmation appears.
The setup is based on Smart Money Concepts (SMC), with the supply zone acting as the main area of interest. A rejection from this zone, followed by a bearish CHoCH/BOS or lower-timeframe confirmation,
Gold 1H | Let the Structure Reveal the Next Wave⏱️ Reading time: ~3 minutes
🟦 Scenario 1: Bullish Case
The bullish case does not necessarily require price to move straight higher.
After the recent move, the market may develop a sideways corrective structure and continue moving within the projected range. This would allow the correction to become more complex or time-consuming without necessarily invalidating the larger bullish structure.
Here, time, degree, and the character of the correction are important.
⬛ Scenario 2: Bearish Case
The
XAU/USD 14 September 2026 Intraday AnalysisH4 Analysis:
-> Swing: Bullish.
-> Internal: Bearish.
Bias and analysis to remain the same as analysis dated 30 June 2026.
Price did not print bullish CHoCH to indicate bullish pullback phase initiation. Price instead printed a new low followed by a bullish CHoCH
Price is currently trading within and established internal range, however, I will continue to monitor price with respect to depth of pullback.
Intraday expectation:
Price to trade up to either premium of internal 50% EQ, or
Crude Oil | When Structure Speaks Before the Move⏱️ Reading Time: About 2 Minutes
In our previous crude oil analyses, the goal was never to predict price or choose a fixed direction. Instead, we focused on understanding the structure the market was building.
One of the key possibilities we were tracking was the potential completion of a larger-degree Wave (II). Rather than simply taking a bullish or bearish stance, we waited for the market to reveal the character of its next move.
As the new movement developed, lower timeframes began showin
H1 Reclaim Recovery Below Dynamic ResistanceXAUUSD is trading around 4,332 after another selloff into the lower H1 structure. Price is now testing the 4,330–4,350 Demand / Reclaim Zone, but the broader structure remains capped by the descending dynamic resistance.
The macro environment remains difficult for gold. August U.S. CPI rose 0.4% MoM and 3.4% YoY, reinforcing expectations for a Fed hike this week; markets are pricing roughly an 86% probability of a rate increase. At the same time, Brent has surged above $107 amid renewed Middle
S&P 500 | Wave III: More Upside or a Major Pause?Reading time: about 2 minutes
This chart analyzes the long-term behavior of the S&P 500 through the lens of the Elliott Wave Principle.
In this count, the larger market advance from the 2009 low is viewed as an impulsive structure. The 2020 correction is labeled as Wave II, followed by the development of Wave III — a wave that often represents the strongest part of an impulsive sequence.
Bullish Scenario
In the bullish scenario, Wave III may not be complete yet, and its internal structure co
Episode 07 — The Moment the Market Revealed Its Language🎬 Mr. Nobody’s Chronicle
Season I — The History of Elliott Wave Principle
Episode 07 — The Moment the Market Revealed Its Language
⏱️ Reading time: ~3 minutes
“Sometimes, the greatest discoveries do not begin with an answer... but with the right question.”
After years of studying market charts, one question continued to occupy Ralph Nelson Elliott’s mind:
Why do certain market movements, despite appearing at different times and price levels, seem to share a remarkable similarity?
For many pe
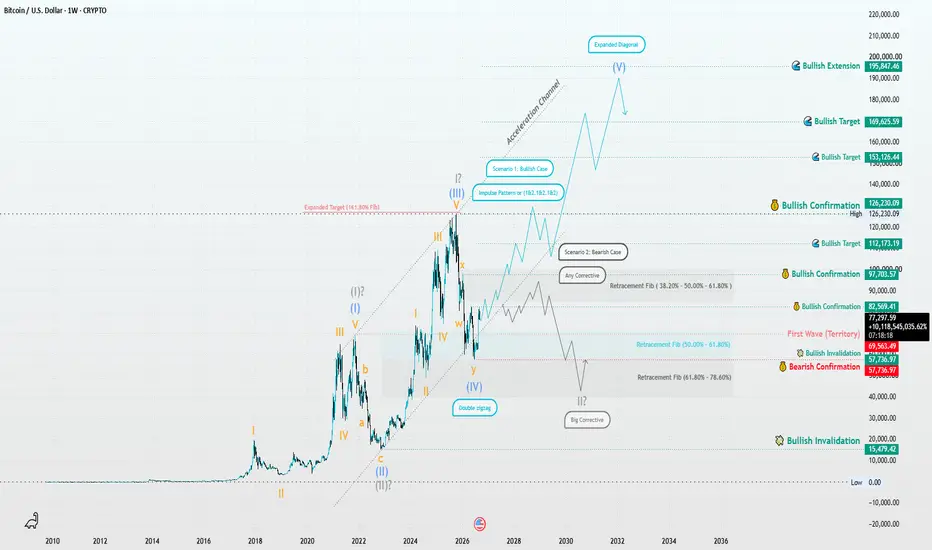
Bitcoin Weekly | Two Macro Paths⏱️ Reading Time: ~3 minutes
Hey everyone,
This weekly analysis takes a long-term look at Bitcoin’s structure. At this stage, I think it’s better to keep more than one interpretation open and let the market reveal more of its internal structure before choosing one count with confidence.
🟦 Scenario 1 | Leading Expanding Diagonal
One possible long-term interpretation is that Bitcoin’s entire macro structure could eventually be viewed as a Leading Expanding Diagonal on the linear chart.
If this
ETH/USD | The Hidden Structure of Wave VETH/USD | The Fifth Wave Reveals Its Structure
⏱️ Reading Time: ~2 minutes
Ethereum, at its largest historical degree, may still be completing a very large corrective structure. In this revised count, the main focus is on the behavior of Waves (I) through (IV) and the change in price personality that followed.
After Wave (IV), the lower-degree structure may be developing as an Impulse within Wave (V). An important point is that Wave III is shorter than Wave I, meaning Wave V can also be short
BNB | The Next Wave?⏱️ Reading Time: ~3 minutes
The weekly BNB chart, shown on a Linear scale rather than a logarithmic scale, is at a point where the larger structure still does not give us a definitive answer. However, two very different paths can be followed from the structure currently developing.
The key question here is not simply whether BNB will go up or down. The more important question is whether the current move is building a new impulsive wave or is still part of a larger corrective structure.
🟦 Scen
Oil (MCL) Trading & Analysis (week of 9/7/26) - part 11-1 so far this week, +0.1R
Winners: +1.1R
Losers: -1R
continue with me in part 2.
-------------
As a learning, beginner day trader I go through the market replay predefining what I am looking for to enter a trade and walk through my thoughts as I experience the market action bar by bar throughout the entire day to see how I handle various events and assess my execution.
This is for me and others to learn if you desire.
H2 Bullish Recovery From Major Demand
XAUUSD is trading around 4,349 after another volatile session around the lower H2 structure. Price remains inside a broader descending channel, but the current location is close to a major demand cluster where a recovery setup may begin to develop.
The macro backdrop remains challenging for gold. U.S. August CPI rose 0.4% MoM and 3.4% YoY, while core CPI increased 0.3% MoM and 2.4% YoY. Markets now price roughly an 85% probability of a Fed rate hike next week, keeping pressure on non-yielding