Molina Healthcare | MOH | Long at $181.69Healthcare providers and services are at a major discount right now: and may be discounted even more this year. I am personally buying and long-term holding the fear, knowing the baby boom generation is going to utilize our healthcare system at a rate unseen in modern times. While the price discounts are valid "right now" given the current political administration's cuts, long-term it is far from valid... The strategy I am using with healthcare stocks ( NYSE:MOH , NYSE:CNC , NYSE:UNH , NYSE:ELV , etc) is cost averaging: not buying one single large position in an effort to predict bottom but buying smaller positions over time to create a cost average "near" bottom. If you are a day trader or want a quick swing in healthcare, I don't think it's going to happen for a bit. But those not entering in the coming months / year will likely miss out on a very large healthcare boom - especially when AI truly enters the picture in this sector...
Fundamentally, Molina Healthcare NYSE:MOH is a very strong company. Low debt-to-equity (.9x), P/E of 8.8x, quick ratio of 1.7x, $41 billion in revenue in 2024. Yes, there will be issues in the near-term due to Medicaid and other funding cuts. But long-term, this sector is primed to benefit from an aging population.
So, while NYSE:MOH is in a personal buy zone at $181.69, I don't think this is necessarily bottom. I anticipate this stock to drop even further, eventually closing the daily price gap at $135.00. My next buys are in the $150's and $130's, thus cost averaging into a larger position. For true value investors, those prices and anything below is a steal. Today's negative healthcare sector noise is loud, but it does not represent the future.
Targets into 2028:
$226.00 (+24.3%)
$290.00 (+59.6%)
 Long
Long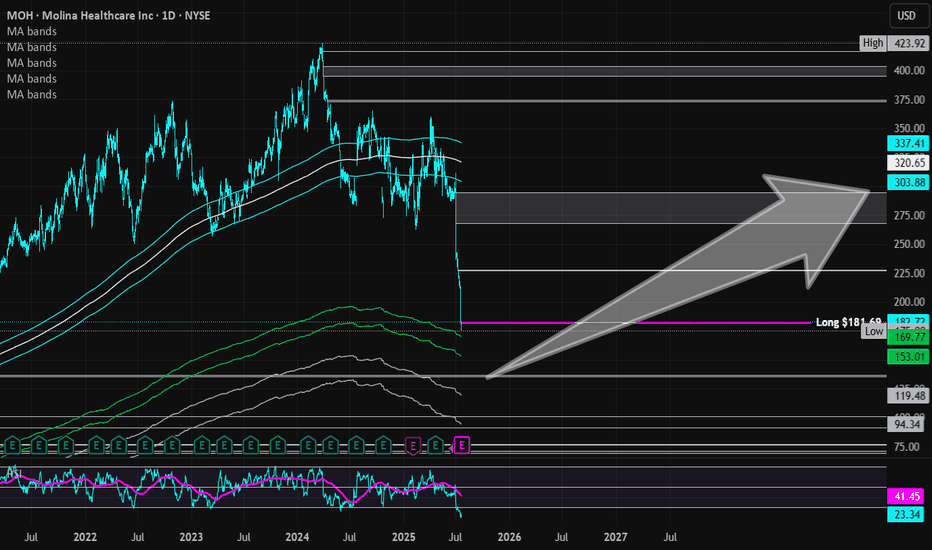
 Long
Long
 Long
Long
Gold (XAUUSD): Institutional Order-Flow Shifts BearishExecutive Summary
Gold has completed a textbook macro distribution phase on the Daily (1D) timeframe. The most significant structural development is the clean breakdown and confirmation below the dynamic 200 EMA. This shift in the macro regime has opened the door for a multi-wave markdown sequence. By mapping the current nested structures, we can identify two primary bearish paths along with the exact invalidation points that define this macro short thesis.
Market Structure & Order-Flow Analysis
As shown, the market is respecting a series of lower highs and lower lows. Institutional supply is consistently overriding demand at key structural inflections. We are currently tracking two nested bearish sequences: the primary macro wave (1D Minor 1 / blue path) and the immediate acceleration wave (1D Minor 2 / pink path). Previous structural demand levels are systematically flipping into active supply zones.
The Bearish Scenarios
Scenario A: Immediate Acceleration (The Pink Path)
Mechanics: Price has recently rallied into Retrac. Zone M2 (pink dashed box near $4,200) and faced immediate institutional rejection. Under this scenario, order-flow momentum remains highly aggressive, and sellers will press the market lower without requiring a deeper relief rally.
Target: A direct continuation toward the 1D Minor 2 Target Box around the $3,600 liquidity pool.
Scenario B: Deep Corrective Test (The Blue Path)
Mechanics: Should the market experience short-term short-covering or a temporary liquidity hunt, price is expected to gravitate toward the higher supply cluster at Retracement Zone Minor 1 (blue dashed box between $4,400 - $4,600). This zone is highly significant as it confluences directly with the retest of the broken 200 EMA from underneath.
Target: A heavy rejection from this macro supply zone will validate the larger extension down toward the major 1D Minor 1 Target Box near the $3,000 psychological milestone.
Structural Invalidation Levels
To trade this setup safely, we must let the market structure dictate our risk parameters.
1. Immediate Bias Invalidation (M2 Failure)
Level: A sustained Daily candle close above $4,400.
Impact: This invalidates the immediate direct markdown thesis (pink line). It signals that a more complex, deeper corrective rally toward Retracement Zone Minor 1 is underway before the next structural leg down can materialize.
2. Macro Thesis Invalidation (The "C-Point" Break)
Level: A Daily candle close above the C-Point High at $4,900.
Impact: This is the absolute macro invalidation for the entire bearish sequence. Breaking above this specific C-Point completely violates the structural rule of lower highs. Reclaiming this level forces a complete Market Structure Shift (MSS) to the upside, invalidating the markdown phase and exposing the entire downside breakdown as a massive institutional liquidity trap.
Trading Metrics to Watch
Primary Bias: Bearish below $4,600 / Structurally Dead above $4,900.
Key Support-Turned-Resistance: The 200 EMA line.
Volume Profile: Look for volume expanding on down-days to confirm institutional participation in the markdown phase.
Disclaimer
Financial Trading Disclaimer: The analysis, chart structures, and price levels presented in this idea are for educational, informational, and research purposes only. This content does not constitute financial, investment, or trading advice.
What path are you taking here? Are you selling the immediate M2 rejection, or waiting for a deeper retest at the 200 EMA? Let me know your thoughts in the comments below!  Short
Short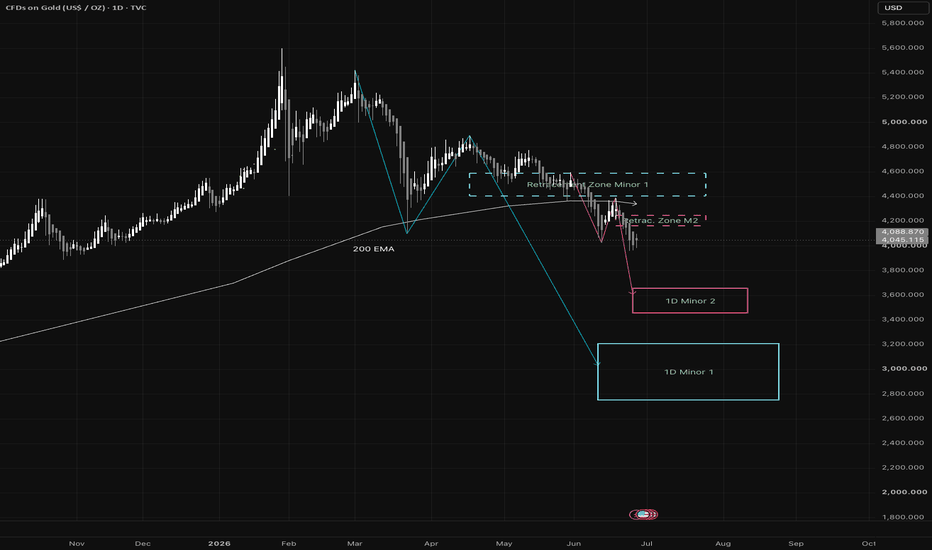
 Long
Long
 Long
Long
 Short
Short
eBay Pulls Back Following SurgeeBay rallied to new record highs in April and May. Now some traders may see an opportunity as the e-commerce stock pulls back.
The first pattern on today’s chart is the 2025 high of $101.15. EBAY passed through that resistance and has stayed above it, which may be consistent with the initial stages of a breakout.
Second is the May 6 low of $104.60. Prices have remained above that level, including a bounce this week. Is new support in place above old peaks?
Third, the 50-day simple moving average (SMA) is above the 100-day SMA. Both are above the 200-day SMA. That alignment, with faster SMAs above slower ones, could suggest that a longer-term uptrend has begun.
Finally, the news flow has grown interesting. Earnings and revenue beat estimates on April 29. GameStop made an unsolicited takeover offer on May 4 (which was rejected). Consumer trends have also shown signs of improvement, highlighted by today’s upward revision in consumer sentiment.
TradeStation has, for decades, advanced the trading industry, providing access to stocks, options and futures. If you're born to trade, we could be for you. Learn more here about TradingView’s Broker of the Year!
Past performance, whether actual or indicated by historical tests of strategies, is no guarantee of future performance or success. There is a possibility that you may sustain a loss equal to or greater than your entire investment regardless of which asset class you trade (equities, options or futures); therefore, you should not invest or risk money that you cannot afford to lose. Online trading is not suitable for all investors. View the document titled Characteristics and Risks of Standardized Options at www.TradeStation.com . Before trading any asset class, customers must read the relevant risk disclosure statements on www.TradeStation.com . System access and trade placement and execution may be delayed or fail due to market volatility and volume, quote delays, system and software errors, Internet traffic, outages and other factors.
Securities and futures trading is offered to self-directed customers by TradeStation Securities, Inc., a broker-dealer registered with the Securities and Exchange Commission and a futures commission merchant licensed with the Commodity Futures Trading Commission). TradeStation Securities is a member of the Financial Industry Regulatory Authority, the National Futures Association, and a number of exchanges.
TradeStation Securities, Inc. and TradeStation Technologies, Inc. are each wholly owned subsidiaries of TradeStation Group, Inc., both operating, and providing products and services, under the TradeStation brand and trademark. When applying for, or purchasing, accounts, subscriptions, products and services, it is important that you know which company you will be dealing with. Visit www.TradeStation.com for further important information explaining what this means.  Long
Long
 Long
Long
 Long
Long
 Long
Long
 Long
Long
XAUUSD — EMA Downtrend, Waiting for a Value Pullback
Fundamental Analysis
Gold remains under bearish pressure as price continues to trade below the main EMA structure. Traders are still watching USD momentum, Treasury yields, and upcoming U.S. macro data.
For now, any short-term recovery should be treated as a technical pullback unless price can reclaim the EMA resistance zone with strong confirmation.
Technical Analysis
On the 2H chart, XAUUSD is still trading below EMA 34, EMA 89, and EMA 200. This confirms that the main trend remains bearish, with the EMA structure acting as dynamic resistance above price.
Price is currently around 4,003 after rejecting from the previous recovery area. The chart shows that gold may create a small corrective bounce toward the EMA value zone before continuing lower.
The first sell reaction area is around 4,045 - 4,060. A deeper pullback may reach the stronger sell swing zone around 4,078 - 4,088. If price rejects from these areas, sellers may continue to control the structure.
The main downside target is the psychological liquidity zone around 3,936 - 3,935.
Important Key Levels
Current price area: 4,003
EMA value zone: 4,045 - 4,060
Sell scalping zone: 4,059 - 4,078
Sell swing zone: 4,078 - 4,088
EMA resistance area: 4,044 - 4,126
Invalidation area: above 4,116 - 4,126
Main downside target: 3,936 - 3,935
Trading Scenario
Main Sell Scenario
Entry: 4,059 - 4,088
Stop Loss: 4,126
Take Profit 1: 4,003
Take Profit 2: 3,960
Take Profit 3: 3,936 - 3,935
Sell Condition
The preferred setup is to wait for gold to correct higher into the 4,059 - 4,088 value zone. This area aligns with the EMA reaction zone, Fibonacci structure, and previous sell pressure.
A sell setup becomes more valid if price forms bearish rejection from this zone, such as a long upper wick, bearish engulfing candle, failed breakout, or lower high below the EMA structure.
If price rejects from the sell zone and breaks back below 4,003, the bearish continuation view becomes stronger. The next downside focus would be 3,960, followed by the psychological liquidity target around 3,936 - 3,935.
Entry Conditions
Wait for price to pull back into 4,059 - 4,088.
Look for bearish rejection before entering sell.
Do not sell aggressively at the low without a pullback.
A break below 4,003 confirms stronger downside pressure.
If price breaks and holds above 4,126, the sell setup is invalid.
Overall, the main view remains bearish while XAUUSD trades below EMA 34, EMA 89, and EMA 200. Gold may create a light corrective bounce first, but the preferred plan is to wait for a reaction from the EMA value zone before looking for continuation toward 3,936 - 3,935.
Do you share the same bearish view on gold, or are you waiting for a cleaner pullback into the EMA value zone first?
Short 
Short 
 Long
Long
 Long
Long
 Long
Long
Airbnb’s Silent BreakoutAirbnb has gone nowhere for years, but now it could be breaking out.
The first pattern on today’s chart is the long-term peak around $144 from June 2025. The short-term rental stock pulled back after challenging that resistance in April and May. It returned to the zone yesterday, establishing a new 52-week high in the process.
Second, the 50-day simple moving average (SMA) is above the 100-day SMA. Both are above the 200-day SMA. That alignment, with faster SMAs above slower SMAs, may suggest a longer-term uptrend is taking shape.
Third, the 8-day exponential moving average (EMA) is above the 21-day EMA. MACD is also rising. Those signals could reflect short-term bullishness.
Finally, airline and hotel companies have recently climbed to new highs. With fuel prices falling, is sentiment shifting in favor of travel stocks?
TradeStation has, for decades, advanced the trading industry, providing access to stocks, options and futures. If you're born to trade, we could be for you. Learn more here about TradingView’s Broker of the Year!
Past performance, whether actual or indicated by historical tests of strategies, is no guarantee of future performance or success. There is a possibility that you may sustain a loss equal to or greater than your entire investment regardless of which asset class you trade (equities, options or futures); therefore, you should not invest or risk money that you cannot afford to lose. Online trading is not suitable for all investors. View the document titled Characteristics and Risks of Standardized Options at www.TradeStation.com . Before trading any asset class, customers must read the relevant risk disclosure statements on www.TradeStation.com . System access and trade placement and execution may be delayed or fail due to market volatility and volume, quote delays, system and software errors, Internet traffic, outages and other factors.
Securities and futures trading is offered to self-directed customers by TradeStation Securities, Inc., a broker-dealer registered with the Securities and Exchange Commission and a futures commission merchant licensed with the Commodity Futures Trading Commission). TradeStation Securities is a member of the Financial Industry Regulatory Authority, the National Futures Association, and a number of exchanges.
TradeStation Securities, Inc. and TradeStation Technologies, Inc. are each wholly owned subsidiaries of TradeStation Group, Inc., both operating, and providing products and services, under the TradeStation brand and trademark. When applying for, or purchasing, accounts, subscriptions, products and services, it is important that you know which company you will be dealing with. Visit www.TradeStation.com for further important information explaining what this means.  Long
Long
IBM bullish reversal tradeIBM ema ribbons are bullish and stochastic rsi is printing a bullish reversal.
IBM 1:4 trade idea:
Long: 264
Stop: 242
TP1: 287
TP2: 309
TP3: 332
Final Profit: 355
IBM (IBM) unveiled what it called the world's first sub-1 nanometer, or nm, chip technology, featuring a revolutionary transistor architecture at the 0.7 nm, or 7 angstrom, node.
The U.S. tech giant said the achievement marks a landmark moment for an industry facing the physical limits of traditional chip scaling. The new sub-1 nm chip packs nearly 100B transistors onto a chip the size of a fingernail, nearly twice the density of IBM's 2 nm chip, unveiled in 2021.
IBM noted that the new sub-1 nm chips are 70% more efficient, or 50% more powerful, than the 2 nm node chips.
"Today’s popular AI accelerators can produce about 1,500 TOPS (or trillions of operations per second), and IBM researchers estimate one using 7 angstrom technology could deliver about seven times more, or 7,000 TOPS. If 7 angstrom chips were used to train today’s massive, frontier model LLMs, we could drastically cut training time from around three months to a couple weeks," said IBM in a separate blog post.
The company said that to produce this chip, its researchers developed an entirely new transistor architecture called nanostack, the industry's first known three-dimensional, nanosheet-based design. Nanostack represents a major advance beyond nanosheet technology, the industry's current leading-edge architecture, invented by IBM, the company noted.
Bakolia, Ravikash. "IBM Surges After Unveiling New Sub-1 Nm Chip Technology." Seeking Alpha, June 25, 2026.  Long
Long

 Long
Long