Crude Oil: Beyond Market Direction, Understanding Market StructuHello everyone,
In this update, we take another look at the Crude Oil chart.
We have slightly changed the way we present our analysis. The goal is not simply to say whether the market is bullish or bearish, but to understand the structure that the market is currently developing.
From the bullish perspective, or the aggressive scenario, after completing a large corrective cycle that included a complex Wave II structure, the market was able to create an impulsive move. At the moment, there is a possibility that the recent correction is a sharp and short-term structure, which could represent part of a lower-degree Wave II.
However, price action still needs to be studied on lower timeframes, because the market may be developing a more complex structure or a nested formation. If the next move shows a clear impulsive character, it could provide the first confirmation for a continuation of the bullish path.
On the other hand, the conservative scenario remains valid. If the market fails to develop the expected impulsive structure, a deeper correction may still occur, potentially forming part of a higher-degree Wave II.
But the main purpose of this analysis is not to predict the market direction.
I am not attached to a bullish or bearish outcome. My focus is on following the structure, getting closer to the logic of the Elliott Wave Principle, and understanding the personality of market movements.
Every pattern has its own story. Sometimes the market moves with strength; sometimes it becomes complex and time-consuming. Our job is not to force a story onto the market. Our job is to observe and allow the real structure to reveal itself.
Patterns whisper. I listen.
— Mr. Nobody
CFDs on Crude Oil (Brent)
Aug 11
Wave III?
 Long
Long
 Long
Long
 Short
Short
DG Congestion Exit & Action: Trading Inside and Out of the RangeOnce congestion has entered and a Block Level has formed, price has two options: bounce around inside the range, or break out of it. Here we cover trading the breakout (Congestion Exit) and trading the bounce (Congestion Action). Together they explain how to read what the market is doing while it's stuck between its two confines.
The chart above walks through the whole sequence in order. During the weeks of February 9th and 17th, 2026, price simply oscillates — this is Congestion Action, the market swinging back and forth between its confines without committing to a direction. From there, the range finally gives way and a trend run down begins.
That trend down is what sets up the next Congestion Entrance candle, in the week of March 30th — and that candle is what "creates" the Block Level, marked by the orange line on the chart. The very next week, price comes back down and touches that Block Level again, this time producing a YES pattern — confirmation that the block is genuinely strong. That confirmation is what kicks off the multi-week trend up that carries price from the low-$240s all the way past $310.
📦 What Is Congestion Action?
Congestion Action is what happens when the market oscillates back and forth between the two confines of congestion — the Dotted Line on one side and the Block Level on the other.
It's the "waiting room" state: the trend has ended, congestion has been entered, and now price is swinging between its two walls without committing to a direction. Congestion Action is strongest — and most likely to occur — when both the Dotted Line and the Block Level are strong. If either one is weak, the range won't hold for long.
Congestion Action is unlikely to show up at all — or will only appear briefly — when the higher time period (HTP) is itself in a trend run. A trending HTP tends to pull the lower time period through congestion quickly rather than letting it settle into a real range. The two-week stretch in mid-February on AAPL is a clean weekly-chart example: neither confine gives way, so price just keeps testing both sides of the range.
🚪 What Is Congestion Exit?
Congestion Exit is the trend run that grows out of Congestion Action — the first bar (and the bars that follow) that finally leaves the confines of congestion in one direction (6th April candle).
It's still tied to congestion until it proves itself: the very next bar after a congestion exit bar has to also be a trend-run bar for the exit to be considered confirmed. If it isn't, price slips back inside the range, a new congestion entrance is set up, and the "exit" that just happened no longer counts — the confines simply reset.
This is essentially what plays out after the February congestion action on AAPL: the range finally breaks to the downside and a trend run down unfolds. That trend down runs its course and, in the week of March 30th, produces a fresh congestion entrance candle — the bar that creates the new Block Level around the $243–244 area.
💡 Theory – What You Expect
Signs that a Congestion Exit is genuinely underway usually include several of the following at once:
Energy is pushing clearly in the direction of the exit.
Energy against the exit direction is breaking down.
The 6-1 lines that had been holding against the exit direction start to disappear.
A c-wave often appears in the direction of the exit.
For Congestion Action, the signs point the other way — containment, not breakout:
6-1 lines are common and tend to hold on both sides of the range — this is really the only place they show up reliably.
1-1 zones hold rather than break.
Nearby support/resistance areas do the heavy lifting — aka"learning to love the Nearby."
Expect minimal or non-existent c-waves. If one does appear, expect the next bar's nearby energy to push price back inside the envelope and continue the Congestion Action.
⚙️ How They Form
Congestion Exit sets up when one side of the congestion confines breaks while the other holds — the trend run will develop in the direction of the break, not the direction of the hold.
Congestion Action sets up under a specific HTP condition: when the higher time period is itself working on a congestion entrance rather than trending. In that scenario, nearby resistance sits above the HTP envelope top and nearby support sits at the HTP envelope top — and if the block that forms there is strong, it holds and produces Congestion Action on the lower time period.
In both cases, the HTP is the guide. It tells you which side of the range is more likely to give way, and it tells you whether a real range-bound phase is even possible right now.
On the AAPL chart, the week right after the Block Level is created is where the theory earns its keep: price comes back down and touches that block again, and this time it holds with a clear YES pattern — the sign that this block is strong rather than about to be sliced through. That single confirmation is the trigger for the multi-week trend up that follows.
📈 How to Trade Them
Read the HTP first:
If the HTP suggests a strong block and a strong dotted line, favor Congestion Action — assume the range holds and play it from wall to wall.
If the HTP suggests one of the two confines is weakening, favor Congestion Exit — prepare for a breakout in the direction that's giving way.
Watch which side is breaking down:
6-1 lines against the anticipated exit direction disappearing is an early tell that the range is about to fail.
A c-wave forming in the exit direction adds confirmation.
Know your state clearly and quickly:
Congestion is always either in Action (oscillating) or moving toward Exit (breaking out) — there's no in-between. Knowing which one you're in, and when you're about to leave it, is the core skill for this stage of trading.
Remember the exit isn't confirmed on the first bar:
If the bar right after the apparent exit fails to continue as a trend-run bar, price is back in congestion, not out of it. Treat the first exit bar as a proposal, not a fact, until the next bar confirms it.
🧭 In Simple Terms
Think of Congestion Action and Congestion Exit as two phases of the same standoff:
Congestion Action = the ball bouncing between two walls. Nothing has broken yet — you play the bounce.
Congestion Exit = the ball finally punching through one wall. You play the direction of the break, but you wait for one more bar to be sure it's real.
The higher timeframe tells you which wall is more likely to give — your job on the lower timeframe is to watch the 6-1 lines, the flow, and the nearby zones to confirm which phase you're actually in.
On AAPL, the ball bounced between the walls through February (Congestion Action), then punched through the bottom into a trend down, before a fresh Block Level got built in late March and held on its first retest — the YES pattern that flipped the market into a multi-week trend up.
✅ Quick Recap
Concept Meaning
Congestion Action : Price oscillates between the Dotted Line and the Block Level :
Congestion Exit : A trend run that breaks out of the congestion confines
Strong Range (both confines strong) : Favors Congestion Action — trade the bounce
Weak Confine (one side giving way) : Favors Congestion Exit — trade the breakout
Confirmation : The bar after the exit bar must also be a trend-run bar
HTP Trending : Congestion Action rarely forms — HTP pulls price through quickly
HTP in Congestion Entrance : Sets up the conditions for Congestion Action on the LTP
Goal : Identify which of the two states you're in, and act only once it's confirmed  Long
Long
 Long
Long
 Long
Long
Long 
XAU/USD 27 August 20216 Intraday AnalysisH4 Analysis:
-> Swing: Bullish.
-> Internal: Bearish.
Bias and analysis to remain the same as analysis dated 30 June 2026.
Price did not print bullish CHoCH to indicate bullish pullback phase initiation. Price instead printed a new low followed by a bullish CHoCH
Price is currently trading within and established internal range, however, I will continue to monitor price with respect to depth of pullback.
Intraday expectation:
Price to trade up to either premium of internal 50% EQ, or H4 demand zone before targeting weak internal low, currently priced at 3,942.100.
Note:
Gold remains volatile as tensions between the US, Israel, and Iran keep safe‑haven demand elevated.
Markets are reacting quickly to every headline, while uncertainty around the Fed’s easing path and shifting U.S. policy under President Trump, especially tariffs continues to fuel choppy price action.
For newer traders, the key is simple, stay flexible and manage risk carefully, as fast spikes and sudden reversals are a normal part of the current XAU/USD environment.
H4 Chart:
M15 Analysis:
-> Swing: Bearish.
-> Internal: Bullish.
Bias and analysis to remain the same as analysis dated 25 August 2026.
Price has continued bullish, printing bearish CHoCH's, and containing higher with very minimal pullbacks. I will therefore apply discretion and not classify them as such.
Price has since printed a further bearish CHoCH. I shall however continue to monitor this with respect to depth of pullback.
Price is currently trading within an established internal range.
Intraday expectation:
Price to trade down to either discount of internal 50% EQ, or M15 supply zone before targeting weak internal high, currently priced at 4,697.105.
Alternative scenario:
You will note price has reacted at an H4 supply zone, therefore, it would be entirety feasible if price was to target strong internal low and print a bearish iBOS, given the internal structure of H4 is bearish.
Note:
Gold remains highly reactive on M15 as geopolitical risk continues to drive quick, headline‑led moves.
The tension between the US, Israel, and Iran is keeping safe‑haven demand elevated, with markets still sensitive to any sign of escalation.
At the same time, shifting US tariff policy under President Trump is adding extra uncertainty, fuelling sharp intraday swings and increasing the likelihood of sudden sentiment flips. Liquidity pockets and whipsaws remain common, making disciplined risk management essential.
Gold’s geopolitical premium is still firmly in place, and until tensions ease, short‑term volatility is likely to stay front‑loaded.
M15 Chart:  Long
Long

 Long
Long
BNBUSDT: BULLS ABOUT TO GET TRAPPED?Yello, Paradisers! are BNB bulls about to get trapped after this heavily stretched move into weekly resistance?
💎BNBUSDT is currently showing a bearish reaction from a major weekly resistance area, and the lower timeframes are beginning to confirm that sellers may be taking control.
💎On the 1H timeframe, we have already seen a bearish Change of Character (CHoCH), while the current price structure is also forming what resembles a Head & Shoulders pattern. Both signals increase the probability of a deeper short-term correction.
💎Even though the 4H and 1D structures remain bullish, that does not mean price has to continue moving straight higher. The higher-timeframe price action is currently overstretched, which significantly increases the probability of a healthy pullback before any potential continuation of the larger bullish trend. The lower timeframe is now supporting that scenario as well.
💎However, chasing the bearish move at the current price would not provide the best risk-to-reward opportunity. The more professional approach is to remain patient and wait for a pullback into resistance before looking for a higher-probability bearish entry with a much cleaner risk-to-reward setup.
💎For downside targets, the main areas to monitor are the liquidity resting below the current structure together with the 1H and 4H support zones around $676.56 and $663.44. These areas could act as magnets for price if bearish momentum continues.
💎For invalidation, we want to see price reclaim the resistance area and move above the Head & Shoulders shoulder high with an additional safety buffer. More importantly, we would require a candle close above that invalidation zone rather than reacting to a simple wick above it. Until that happens, the short-term bearish scenario remains valid.
The market does not reward traders for entering first; it rewards traders who wait for the right location, confirmation, and risk-to-reward setup. Stay patient, protect your capital, and trade the structure rather than the emotion.
MyCryptoParadise
iFeel the success🌴  Short
Short
Short 
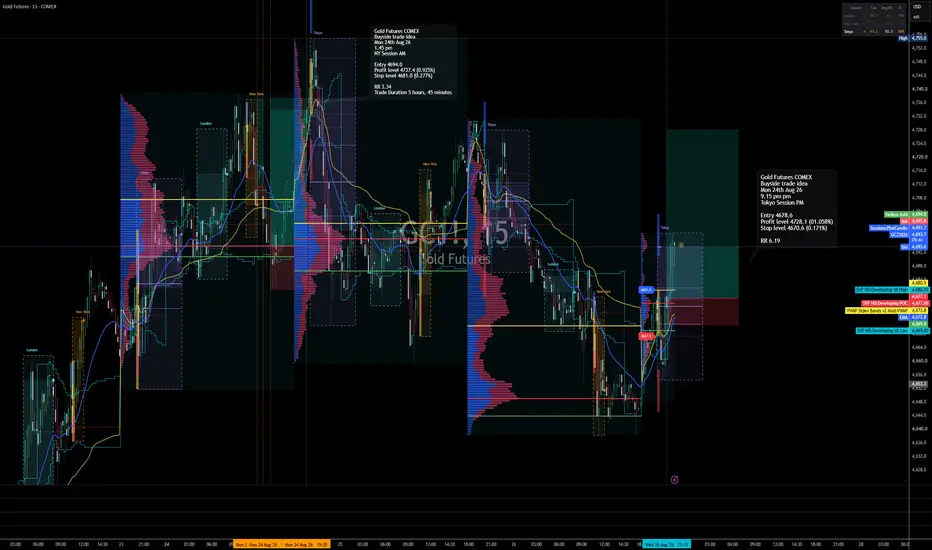
XAU/USD 26 August 2026 Intraday AnalysisH4 Analysis:
-> Swing: Bullish.
-> Internal: Bearish.
Bias and analysis to remain the same as analysis dated 30 June 2026.
Price did not print bullish CHoCH to indicate bullish pullback phase initiation. Price instead printed a new low followed by a bullish CHoCH
Price is currently trading within and established internal range, however, I will continue to monitor price with respect to depth of pullback.
Intraday expectation:
Price to trade up to either premium of internal 50% EQ, or H4 demand zone before targeting weak internal low, currently priced at 3,942.100.
Note:
Gold remains volatile as tensions between the US, Israel, and Iran keep safe‑haven demand elevated.
Markets are reacting quickly to every headline, while uncertainty around the Fed’s easing path and shifting U.S. policy under President Trump, especially tariffs continues to fuel choppy price action.
For newer traders, the key is simple, stay flexible and manage risk carefully, as fast spikes and sudden reversals are a normal part of the current XAU/USD environment.
H4 Chart:
M15 Analysis:
-> Swing: Bearish.
-> Internal: Bullish.
Bias and analysis to remain the same as yesterday's analysis dated 25 August 2026.
Price has continued bullish, printing bearish CHoCH's, and containing higher with very minimal pullbacks. I will therefore apply discretion and not classify them as such.
Price has since printed a further bearish CHoCH. I shall however continue to monitor this with respect to depth of pullback.
Price is currently trading within an established internal range.
Intraday expectation:
Price to trade down to either discount of internal 50% EQ, or M15 supply zone before targeting weak internal high, currently priced at 4,697.105.
Alternative scenario:
You will note price has reacted at an H4 supply zone, therefore, it would be entirety feasible if price was to target strong internal low and print a bearish iBOS, given the internal structure of H4 is bearish.
Note:
Gold remains highly reactive on M15 as geopolitical risk continues to drive quick, headline‑led moves.
The tension between the US, Israel, and Iran is keeping safe‑haven demand elevated, with markets still sensitive to any sign of escalation.
At the same time, shifting US tariff policy under President Trump is adding extra uncertainty, fuelling sharp intraday swings and increasing the likelihood of sudden sentiment flips. Liquidity pockets and whipsaws remain common, making disciplined risk management essential.
Gold’s geopolitical premium is still firmly in place, and until tensions ease, short‑term volatility is likely to stay front‑loaded.
M15 Chart:  Long
Long
What Happens When Price Revisits This Fresh Supply Zone on USOILSymbol: USOIL
Timeframe: Daily
Structure: Supply Zone — Rally-Base-Drop
Current Market Context
Price is currently near an identified supply zone . This area is being observed because it originated from a strong imbalance following a Rally-Base-Drop structure.
The formation consists of a rally, a relatively compact base, and a subsequent bearish leg-out. From a market-structure perspective, this sequence can provide useful context for studying how price behaves when it later revisits an area associated with previous selling pressure.
Why This Zone Is Technically Significant
Several characteristics make this area technically interesting:
• Fresh zone: Price has not meaningfully revisited the zone since its formation.
• Strong leg-out: The departure from the base was relatively decisive, creating a visible expansion in price.
• Quality basing structure: The consolidation before the bearish move provides a clearly defined structural reference.
• Market structure: The zone can be studied alongside surrounding swing highs, swing lows, and the broader sequence of price expansion and retracement.
What Can Happen During a Revisit?
A revisit to a supply zone does not guarantee rejection.
One possible scenario is that price reacts around the zone and begins developing bearish price action. Such a reaction could include rejection candles, a change in short-term swing structure, or renewed downside momentum.
Another possible scenario is that price continues through the zone and establishes acceptance above it. This could indicate that the historical supply is no longer influencing price in the same manner.
A third possibility is a period of consolidation around the area, where price provides limited directional information before a clearer structure develops.
Confirmation Matters
The zone itself represents a technical area of interest rather than a predetermined outcome.
Price action confirmation can provide additional context when studying the reaction. Observations may include rejection, changes in market structure, momentum shifts, or sustained acceptance beyond the zone.
These observations are part of technical analysis and should not be interpreted as trading signals.
Invalidation Is Possible
Supply zones can weaken or become invalidated.
If price moves decisively through the area and establishes sustained acceptance above it, the original Rally-Base-Drop interpretation may become less relevant.
This illustrates an important principle of supply-and-demand analysis: a historical imbalance does not guarantee that the same area will produce the same reaction in the future.
Risk Management — Educational Perspective
From a general trading-education perspective, risk management involves recognizing that any technical interpretation can be incorrect.
Concepts such as position sizing, predefined invalidation conditions, and controlled exposure are commonly used to manage uncertainty. These concepts are presented for educational purposes and are not recommendations for any particular trade or individual.
Key Observation
The interesting question is not whether this supply zone must hold.
The technical question is:
How does USOIL behave when price interacts with this fresh Daily Rally-Base-Drop structure?
The resulting price action may provide additional information about the evolving market structure, regardless of whether the reaction is bullish, bearish, or inconclusive.
This publication is intended solely for educational and informational purposes. It reflects a technical analysis of market structure and should not be interpreted as investment advice, a recommendation, or a solicitation to buy or sell any financial instrument. Always perform your own analysis and manage risk according to your individual circumstances.
Short 
USDJPY 2H: What Happens at This Fresh Supply Zone?Symbol: USDJPY
Timeframe: 120 Minutes
Structure: Supply Zone — Rally-Base-Drop
Current Market Context
Price is currently near an identified supply zone . This area is being observed because it originated from a strong imbalance following a Rally-Base-Drop structure.
The zone represents an area where historical price action showed a relatively compact basing phase followed by a strong bearish leg-out. From a market-structure perspective, this type of formation can be useful for studying how price behaves when it revisits an area associated with previous supply.
Why This Zone Is Technically Interesting
Several characteristics make this area worth observing:
• Fresh zone: Price has not meaningfully revisited the area since its formation.
• Strong leg-out: The departure from the base was relatively decisive, indicating a notable imbalance in the observed price action.
• Quality basing structure: The base shows comparatively contained price movement before the expansion lower.
• Market structure: The formation can be examined in the context of curve analysis.
What Can Happen When Price Revisits Supply?
A revisit does not guarantee a particular outcome.
One possible scenario is that price encounters renewed selling pressure around the zone and begins forming bearish price-action structures.
Another possibility is that price moves through the zone, indicating that the historical supply may no longer be influencing price in the same way.
A move through the area could therefore provide useful information about how the market is interacting with this previously identified supply.
Conversely, rejection from the zone could become an interesting example of how price responds when returning to a fresh Rally-Base-Drop structure.
Confirmation Matters
The zone itself is only a technical area of interest. Price action confirmation can provide additional information about whether the market is actually reacting to the area.
Examples of observations could include rejection, changes in swing structure, momentum shifts, or sustained acceptance above the zone. These are analytical observations rather than predetermined signals.
Invalidation Is Also Possible
Supply zones are not permanent. A sustained move through the area could weaken or invalidate the original structural interpretation.
This is an important concept when studying supply and demand: historical imbalance does not guarantee that the same imbalance will influence future price action.
Risk Management — Educational Perspective
From a general trading-education perspective, risk management involves considering the possibility that a technical thesis may be incorrect.
Concepts such as predefined invalidation conditions, position sizing, and controlled exposure are commonly discussed as ways of managing uncertainty.
These are general educational concepts rather than recommendations for any particular market participant or trade.
Key Observation
The interesting question is not whether this supply zone must hold.
The more useful technical question is:
How does USDJPY behave when price interacts with this fresh Rally-Base-Drop structure?
That price-action response may provide additional information about the current market structure.
This publication is intended solely for educational and informational purposes. It reflects a technical analysis of market structure and should not be interpreted as investment advice, a recommendation, or a solicitation to buy or sell any financial instrument. Always perform your own analysis and manage risk according to your individual circumstances.